Mapping data on An AFNI Template

AFNI version: AFNI_24.2.01 'Macrinus'

I have NIfTI files created in R that I want to map onto an AFNI template (TT_N27_SSW) for visual representation. The data originates as a .csv matrix (x, y, z coordinates and a column for visual stimuli) and is then converted into a .nii file.

I can visualize the data in AFNI, but I can't find clear documentation on how to align it with the template. I've followed tutorials and searched the official YouTube channel without success. Can anyone point me to documentation or steps for mapping a .nii file onto an AFNI/SUMA template?

The issue isn't with loading data or templates, just with aligning the data to the template.

Apologies in advance - I'm a Master's student working on my thesis, and my research advisor is in another country and is not very available to help.

Howdy-

Can you possible show an image of what you want to align to the template?

Alignment to a template will typically be done by an anatomical-looking dataset. If you have calculated, say, modeling results in R, those would not be something you would align to the template directly. You would take the anatomical dataset that they sit on, perform alignment using that, and then apply the warp/transform to your results.

Just for reference, there is a playlist about alignment considerations. The particular procedure mentioned above is covered probably starting about here (and for about the following 10 mins) in the first of those videos.

Typically, we might expect that the alignment+transforming of your "input" data would already be done, so that your input to R is in that final space already, and then the output is already there (because it often won't have anatomical information to drive the alignment).

--pt

Thanks for the quick response!

Here is an image of (one of the views of the fMRI data) what I'm trying to align:

I created the .nii files to show activation patterns from fMRI scans, which can be visualized in AFNI. However, I haven't found any documentation in the R package on how to 'paste' these values onto an anatomical brain scan. I initially thought I could use AFNI’s overlay/underlay options, with the template in the underlay and my data in the overlay, but it doesn’t seem to align correctly.

Based on your comment, it sounds like I should first align the anatomical dataset to the template and then apply the warp/transform to my results. That playlist does show how that is done, correct?

Thanks again for the clarification!

Hi-

The steps you mention are correct, yes.

However, I don't see much signs of anatomical structure here. Does this overlay on some anatomical/EPI brain dataset, that would be aligned to the reference template? Normally, I would expect to see some semblance of the underlying structure within even a statistical or other "derived" dataset.

--pt

Hi again,

You are correct that the image I provided does not contain an anatomical structure. It represents my data as loaded into AFNI, with the template being a separate file.

I apologize if my explanation has been unclear, so I’ll try to clarify further:


When I set up AFNI to align my data onto the template, I use the following steps in Ubuntu via WSL:

  1. Set the path with: cd /mnt/c
  2. Open the template with: afni -dset TT_N27_SSW.nii.gz
  3. Open my dataset with: afni -dset [file_name].nii

Alternatively, I sometimes open AFNI using just afni, and then manually load files via the overlay/underlay buttons. In this case:

  • I set the underlay to the template (TT_N27_SSW.nii.gz)
  • I set the overlay to my data file ([file_name].nii)

The part I'm struggling with is understanding how my data would be displayed onto an anatomical structure within the AFNI/SUMA pipeline. Whether this is due to a lack in my understanding of AFNI or missing some critical piece of documentation, I’m not clear on how to achieve this.

From the tutorials I’ve seen, none have covered the process of converting original files into .nii or similar formats that AFNI can read - they tend to start with the files already prepared. I assumed that loading the template would set the anatomical structure, and that overlaying my data would then display the patterns of activation on that structure.

However, it seems I may be missing a step or important detail.

Hi-

What format is your current dataset? Is it NIFTI or BRIK/HEAD? Or an image? If it isn't a neuroimaging dataset, converting it to be one will depend a lot on what it is.

If it is a neuroimaging dataset, then what is the output of:

3dinfo -space DSET

?

--pt

After reviewing the format of the dataset, I’ve realized that it isn’t currently structured as a neuroimaging dataset. I suspect this is because it hasn’t been properly aligned to an AFNI template. I followed the steps outlined in the RNifti documentation to convert the file, but I may have overlooked something during the process.

While using that code you provided, I received the following message:

AFNI converts NIFTI_datatype=64 (FLOAT64) in file /mnt/c/Documents/GitHub/FPO_capstone/visualization/3d_nii/subj03_face.nii to FLOAT32 
Warnings of this type will be muted for this session. 
Set AFNI_NIFTI_TYPE_WARN to YES to see them all, NO to see none.

It also flagged that there was no spatial transform (neither qform nor sform) in the NIfTI file:

WARNING: NO spatial transform (neither qform nor sform), in NIfTI file 'file_location'

I’m unsure of what step I may have missed during the conversion process. Any advice on how to address this or properly align the dataset with an AFNI template would be appreciated.

Howdy-

Maybe taking a step back, how was the above green-with-red-lines dataset created? Was this using an R script on an input brain dataset? Showing an image of that might help.

Dealing with header/metadata parts of data can be quite tricky; that is a major part of the infrastructure of developed software tool packages.

--pt

I received the initial .csv matrix data from a fellow researcher in the lab, which had been approved by our head researcher (my advisor). Given that the original data should be correct, I suspect there may be an issue with my code or the transformation process, resulting in the .nii files not being formatted as expected.

Here’s the code I used to transform the data from multiple participants into .nii files. Initially, I tested the transformation with one participant and, after what appeared to be successful results, I altered the code to apply the conversion to all participants’ data.

subject_numbers <- c("03", "04", "05", "06", "07", "08", "09", "10")

# Iterate over each subject number
for (subj_num in subject_numbers) {
  df_name <- paste0("subj_", subj_num)

  df <- get(df_name)
  
  # Dataframe dimensions
  dim_x <- max(df$x)
  dim_y <- max(df$y)
  dim_z <- max(df$z)
  
  # Arrays for each stimulus type
  face_array <- array(0, dim = c(dim_x, dim_y, dim_z))
  place_array <- array(0, dim = c(dim_x, dim_y, dim_z))
  object_array <- array(0, dim = c(dim_x, dim_y, dim_z))
  
  # Filling arrays with data
  for (i in 1:nrow(df)) {
    face_array[df$x[i], df$y[i], df$z[i]] <- df$face[i]   # Face stimulus
    place_array[df$x[i], df$y[i], df$z[i]] <- df$place[i]  # Place stimulus
    object_array[df$x[i], df$y[i], df$z[i]] <- df$object[i] # Object stimulus
  }
  
  # Creating NIfTI files for each stimuli
  face_nifti <- asNifti(face_array)
  place_nifti <- asNifti(place_array)
  object_nifti <- asNifti(object_array)
  
  # Defining output filenames
  face_output_file <- paste0("subj", subj_num, "_face.nii")
  place_output_file <- paste0("subj", subj_num, "_place.nii")
  object_output_file <- paste0("subj", subj_num, "_object.nii")
  
  # Write the NIfTI files
  writeNifti(face_nifti, face_output_file)
  writeNifti(place_nifti, place_output_file)
  writeNifti(object_nifti, object_output_file)
}

Thanks for clarifying that. I will note firstly that I don't know R well.

I typically would not expect a CSV file to hold data that is directly mappable to create a full 3D NIFTI file. I guess it is possible that there could be Ntotal rows in the file, where Ntotal = Ni * Nj * Nk, the total number of voxels for a Ni by Nj by Nk matrix. The ordering of those rows would have to be consistent and meaningful relative to the data read in. You would have to make sure that the order to reading along a matrix dimension when "flattening" the input matrix is exactly mapped when writing out the data to 3D matrix again. Do you know the order of reading in x, y and z directions? I would have thought there would have be three loops to fill in a 3D array, for example.

Additionaly, the header information would also have to be present and correct, reporting what type the data have, what voxel size is present, the location of the origin, etc. I don't see where the header information would come from here. How would the voxelsize be known? is the "get()" function a reading a NIFTI dataset, so df has that info? Without knowing the voxelsize and other header information, the data would not be expected to write out into the correct part of "space" to overlay a neuroimaging volume.

Those would be important issues to resolve here.

--pt

Do you think that it would be 'easier' to do the conversion to .nii in python? By 'easier', I mean is there more documentation? Because I haven't been able to find a ton of documentation on converting files in R. I'm more comfortable in R, but I do know how to use Python.

I would start by visualizing a slice of the 3D data in R in whatever way you are most comfortable. You could visualize the input data, and the output data, and make sure that both make sense. The import data should presumably be viewable as a NIFTI/volume in some way, so you have a "known" you can verify the steps on? Then, it would be easier to work on the export your results confidently. Getting the flattening of a 3D matrix on import -> 1D sequence (it sounds like) during analysis -> 3D matrix on export is the priority.

--pt

Hello - It's been a few days but I appreciate all the advice. It's helped significantly.

I visualized the data in 3D, as well as 1D, and now I'm trying to align my data based on the dimensions of my data and the templates available.

But now I'm wondering - should the data align to the template by being as simple as using something such as:

@auto_tlrc -base TT_N27_SSW.nii.gz -input [dataname].nii -prefix [dataname]_aligned

I'm wondering because, if it should be that easy - what would I have done wrong when getting errors about not being able to skulll strip. I just want to make sure that I didn't do something wrong when converting the file, and I just need to transform the data instead.

Howdy-

It's good you've been able to visualize the data in 3D. Would you be able to share an image or two of that here? Otherwise, we're flying pretty blind on our end.

The question of whether you need to do an alignment procedure to a template depends on what processing has been done on your data, and what space it is in currently. So, seeing your brain image data which was input to your R processing would also be helpful.

--pt

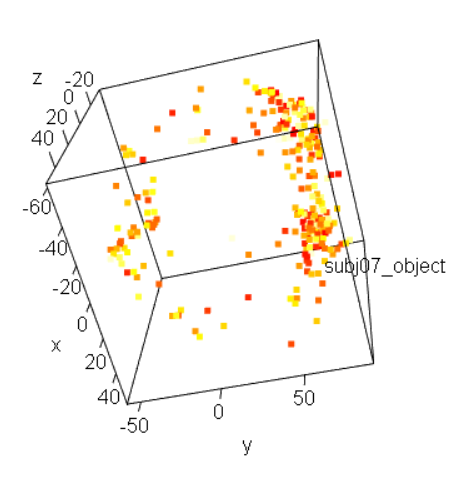
Thank you for the quick response. The data is visualized in two formats, one I know for sure is in a 3D format (using plot3d with the package rgl):

Screenshot 2024-10-01 133354

Sorry - new users can only attach one image in a post.

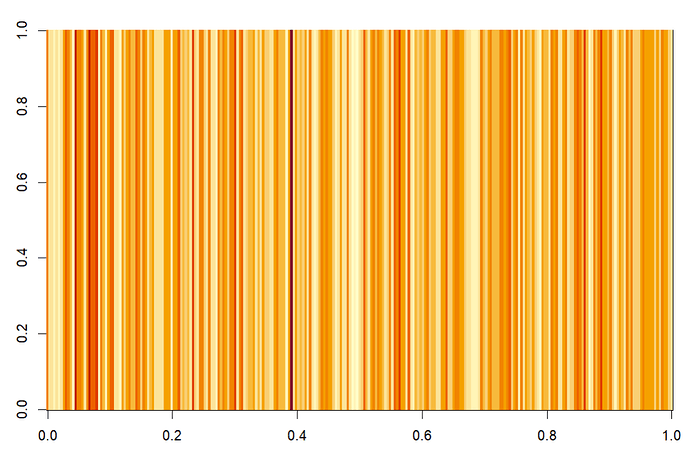
The other (the most current) I believe is still in 3D, it has just been flattened because it is in a .nii format now. The screenshot for that format is just one slice of the data.

Thanks for showing both of those images.

First, to me that 3D plot looks like it could be a reasonable representation of a brain-analysis output. I can kind of picture the ~spherical-ish shape fo the brain there.

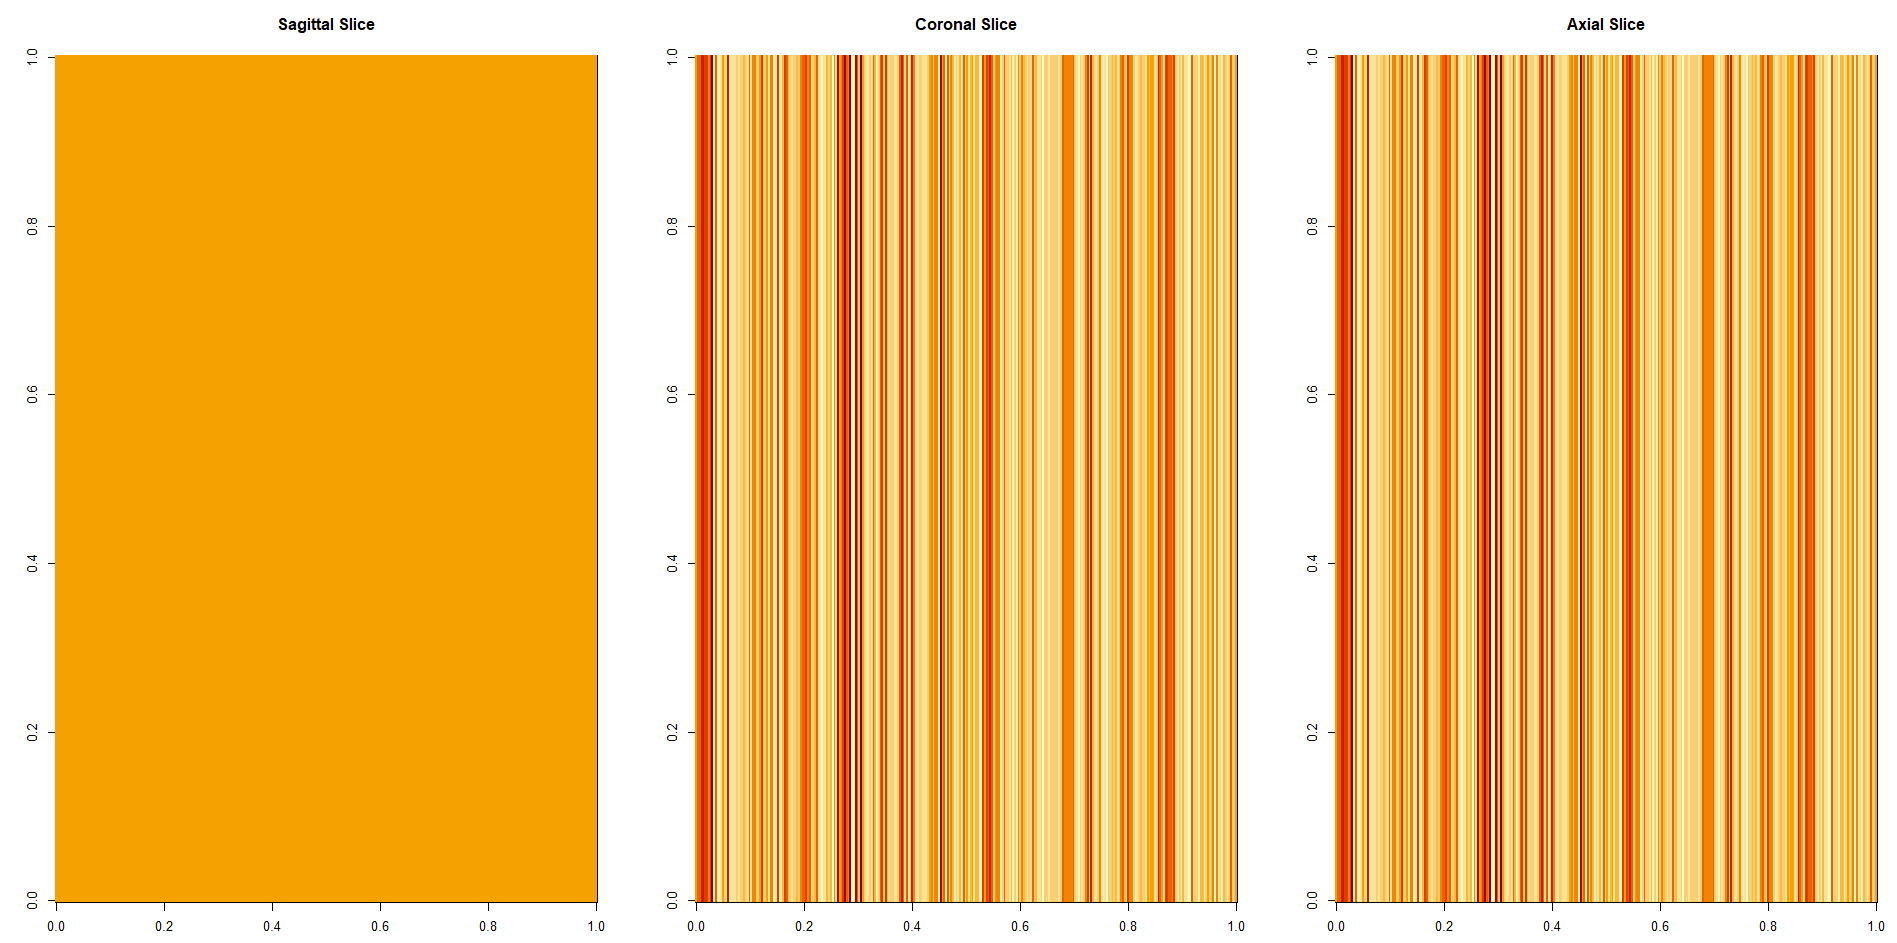
However, that 2D plot does not look like a slice taken from it. It should contain somewhare sparse dots around. However, this 2D image is stripy, as if a single value is projected across each column. That seems to reflect a problem with the coordinate flattening process.

--pt

I have another plot that has all three views, and I think that you're correct about the stripy image. But I'm not really sure what would be effecting that, or causing it to be stripy I should say instead of having dots.

I know you mentioned that you aren't as familiar with R, but I'll add my code (with comments) so you might be able to see what could be the issue.

save_as_nifti3D <- function(subject_arrays, output_dir, rescale_factor = NULL) {
  # Ensure the output directory exists
  if (!dir.exists(output_dir)) {
    dir.create(output_dir, recursive = TRUE)
  }
  
  for (subject in names(subject_arrays)) {
    data_array <- subject_arrays[[subject]]
    
    # Rescale the data if a rescale factor is provided
    if (!is.null(rescale_factor)) {
      # Rescale to 0-1
      data_array <- (data_array - min(data_array)) / (max(data_array) - min(data_array))  
      
       # Scale to 0-5 to make data better viewed
      data_array <- data_array * 5
    }
    
    # Create a NIfTI object
    nii <- as.nifti(data_array)
    
    # Define the output file
    output_file <- file.path(output_dir, paste0(subject))
    
    # Save as NIfTI file
    tryCatch({
      writeNIfTI(nii, output_file)
      cat("Saved NIfTI file for", subject, ":", output_file, "\n")
    }, error = function(e) {
      cat("Error saving NIfTI file for", subject, ":", e$message, "\n")
    })
  }
}

I feel like there's something really simple/crucial that I'm missing - and I don't know what it could be.

Edit:

I wanted to add the dimensions/information of one of my files - I'm hoping that it will point to the issue.

Dimensions: 267 267 267
Voxel Size: 1 1 1
Data Type: niftiImage array
Orientation: LIA
Data Type (Detailed): 64

Summary:
Min: 0.0000
1st Qu: 0.2397
Median: 0.3996
Mean: 0.3844
3rd Qu: 0.5078
Max: 1.0000

Imagine you have a 3D matrix M of dimensions (in terms of voxel counting) X, Y and Z, and you want to flatten it to a 1D-indexed vector V. There are a total T = X*Y*Z elements in both M and V, just that each element of M is accessed as M[i,j,k] and each in V is V[n], say. We want to make a 1-to-one mapping between each i,j,k triplet and a particular n.

I wrote a Python program to do this---again, my lack of R-ability! Python is 0-based, instead of 1-based like R. Also, the interval specifications in Python here are half-open: so range(0,X) means [0,X), which means 0, 1, 2,..., X-1. This is how I picture what should be done, with the two map*() functions here showing how you can go back and forth between "i,j,k" and "n" representations. Note that these functions work as a pair---if one walked through the matrix in a different ordering, then the partner mapping function would have to change.

  • Another important feature to highlight is that when going from a 3D obj-> 1D one, there are 3 nested loops; when going from 1D -> 3D, there is a single loop. I didn't see any nested loops in your program.
# import module to have array types around
import numpy as np

# make matrix with some data, of size 3x4x5
M = np.random.randint(0,100, size=(3,4,5))

# obtain matrix and vector dim variables, from matrix M's dimensions
X, Y, Z = np.shape(M)
T = X*Y*Z

def map_idx_Mijk_to_Vn(i,j,k):
    """Flattening done: row-by-row and plane-by-plane:
    Plane count : X*Y
    Row count   : X
    """
    plane = X*Y
    n     = k*plane + j*X + i
    return n

def map_idx_Vn_to_Mijk(n):
    """Un-Flattening
    Plane count : X*Y
    Row count   : X
    """
    plane = X*Y

    # which plane?
    k = int(n/plane)
    # ... and remove the plane count
    rem = n - k*plane

    # which row?
    j = int(rem/X)
    # ... and remove the row count
    i = rem - j*X

    return i, j, k


# ----------------------------------------------------------------------
# use

# map matrix M (exists) to vector V (initialize with integer zeros first)
V = np.zeros(T, dtype=int) 

for i in range(0,X):
    for j in range(0,Y):
        for k in range(0,Z):
            n = map_idx_Mijk_to_Vn(i,j,k)
            print(i,j,k, n)
            V[n] = M[i,j,k]

# map vector V (exists) to matrix M2 (initialize with integer zeros first)
M2 = np.zeros((X,Y,Z), dtype=int) 

for n in range(0,T):
    i,j,k = map_idx_Vn_to_Mijk(n)
    print(i,j,k, n)
    M2[i,j,k] = V[n]

# -----------------------------------------
# test

# The two printed things here should be equal.
# The trio can be changed and this should work 
my_x = 2
my_y = 3
my_z = 4
print(M[my_x, my_y, my_z])
my_n = map_idx_Mijk_to_Vn(my_x, my_y, my_z)
print(V[my_n])

--pt

Thank you all for your invaluable assistance—it's truly appreciated! With your help, I’ve made significant progress, but I’ve encountered another challenge that I’m unsure how to resolve.

My data range is quite limited. For instance, here are the summary statistics for one of my subjects after scaling the data (multiplying by 1000):

Summary:
Min: 0.0000
1st Qu: 0.0000
Median: 0.0000
Mean: 2.5458
3rd Qu: 0.0000
Max: 255.0000

I visualized the data and believe it is 'correct' after the conversion from a 3D array to a 1D vector and then to a 3D NIfTI.

I’m reasonably confident in my assumption because I can see the lines corresponding to the folds in the vector. However, I want to make sure that my interpretation is accurate. While I can manipulate the data to achieve more variation, I’m hesitant to rely on trial and error alone, as it feels wrong to guess and assume that it was the "right" manipulation to apply just because there's now variance. Any help on how to address this issue would be greatly appreciated