Mapping data on An AFNI Template

If the original AFNI or NIFTI 3D dataset is still available, I would copy it to a hdr/img file pair, and then overwrite the img file. For example, start with something like:

3dcopy ORIG.nii NEW.hdr

And then replace NEW.img with the binary volumetric data.

If the format of the header has change (e.g. shorts to floats or perhaps the intent code), you could use nifti_tool to properly adjust NEW.hdr.

Does that seem like a moderately direct option?

-rick

My research advisor finally got back to me, and admitted that I was trying to make it a lot more complicated than I needed it to be since he didn't really give me any direction and I was just drowning in the documentation. He ended up suggesting (and it worked mostly) using 3dUndump instead with a .txt file.

The conversion worked, and when I load it into AFNI I can see that there is data that is being shown the right way. But, when I try and set the overlay to my template, and the underlay as my data - I can't see my data on the template. I've triple checked that my data is right, but I don't know why it wouldn't be seen.

The structure of my .txt files were just the x, y, and z coordinates with another column for the stimuli.

I'm adding a screenshot of the saggital view, just so you can also see that my data is there. Any ideas how to fix it?

I saw this, and it did look complicated. 3dUndump is the most straightforward way to take a group of xyz or ijk coordinates with corresponding values at those locations and make a dataset. For the xyz coordinates, I find it's easiest to use RAI coordinates with an RAI orientation version of the template. Just be sure the coordinates are where you really expect them to be.

Another way to put markers in a dataset for visualization in AFNI is to use "tags", but these will be specific to the AFNI GUI and visible as crosshairs with a diamond. See a variety of ways to put markers down as spheres instead here:

https://afni.nimh.nih.gov/pub/dist/doc/htmldoc/tutorials/rois_corr_vis/suma_spheres.html

Hi-

What was your 3dUndump command---can you please copy+paste it here?

--pt

I made a .sh file to run in ubuntu/WSL.

# Define the master dataset, input, and output directories
master="/mnt/c/.../TT_N27+tlrc"
input_dir="/mnt/c/.../text_data"
output_dir="/mnt/c/.../afni_data"

# Create the output directory if it doesn't exist
mkdir -p "$output_dir"

# Loop through each text file in the input directory
for file in "$input_dir"/*.txt; do
    filename=$(basename "$file" .txt)
    
    output_file="$output_dir/$filename+tlrc"

    # Run the 3dUndump command
    3dUndump -prefix "$output_dir/$filename" -master "$master" -xyz "$file"

 if [ $? -ne 0 ]; then
        echo "Conversion failed for $file"
    else
        echo "Converted $file to AFNI format: $output_file"
    fi

done

echo "All conversions completed."

OK, I think that looks good. But you are unable to open AFNI, make the "TT_N27+tlrc." dataset be underlay and overlay one of those created files? By using -master .. the grids should match between the dataset, so there should be no problem (some grid differences are even fine of overlaying/underlaying, just not spacename differences, but that shouldn't appear here because of the use of the -master .. option).

The only question that should be needed to check is about making sure your coordinates' (x,y,z) locations have the expected sign conventions to match the dataset, but we can check that separately.

--pt

Hello again,

It has been a while since I needed some advice - but my research advisor has been fairly helpful as of late, and only recently has gone silent again for the time being. After much discussion and work, I have been able to (fairly) confidently visualize the data we have.

My only issue now is, the visualization isn't exactly as we were expecting it to be, and I don't know why. It could be due to the resampling method, how I used 3dUndump, or if there's a setting I need to change in the AFNI UI.

Here is the information that is most likely needed:


.txt file format:

This is a slight sample of the data that is being used. The first 3 colums are showing the coordinates (x, y, or z) and the last column is representing a category of stimuli (1, 2, or 3)

-15.449 -12.903 -32.775 1
-46.522 -10.19 -33.231 2
-25.409 -24.693 -28.62 2
44.35 0.53167 -28.234 1
-47.869 31.447 -26.011 1
31.948 38.032 -25.115 1
31.466 41.814 -25.198 2
30.984 45.595 -25.282 2
54.025 15.967 -20.338 2
53.543 19.749 -20.421 3

Resampling File:

The functional mask files from this dataset is taken from my research advisor in our research drive, and is being used to apply the correct resolution to our anatomical template (MNI_caez_N27+tlrc.).

The resampling file contains BRIK/HEADER files for each subject, which are just binary masks, with a 1 everywhere there is cortex in 0 everywhere else. But mainly, they are at the right functional resolution which is the most important part (or so I was told, and am inclined to believe since the visualization is more accurate now). So when I used each subject's mask file as the master file for 3dundump, it will autmoatically then be at the correct resolution.


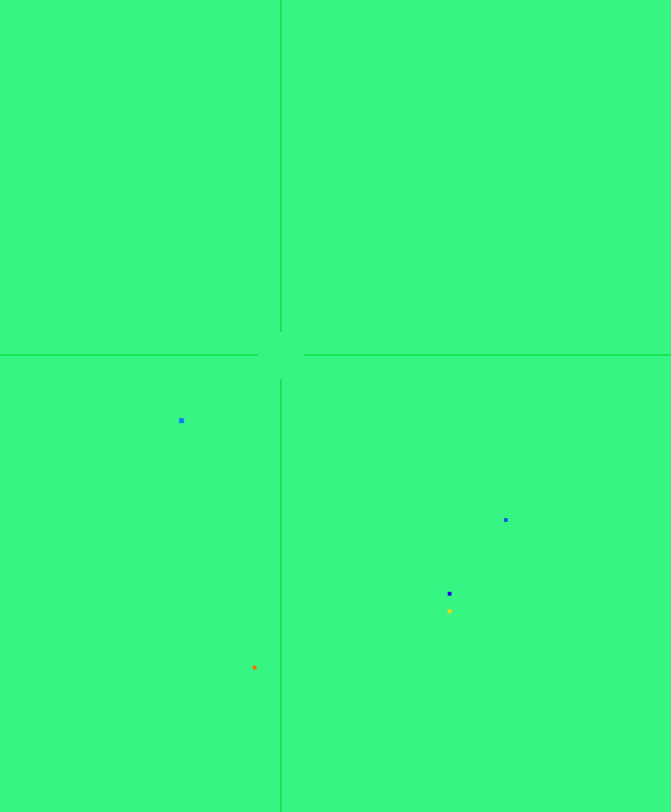
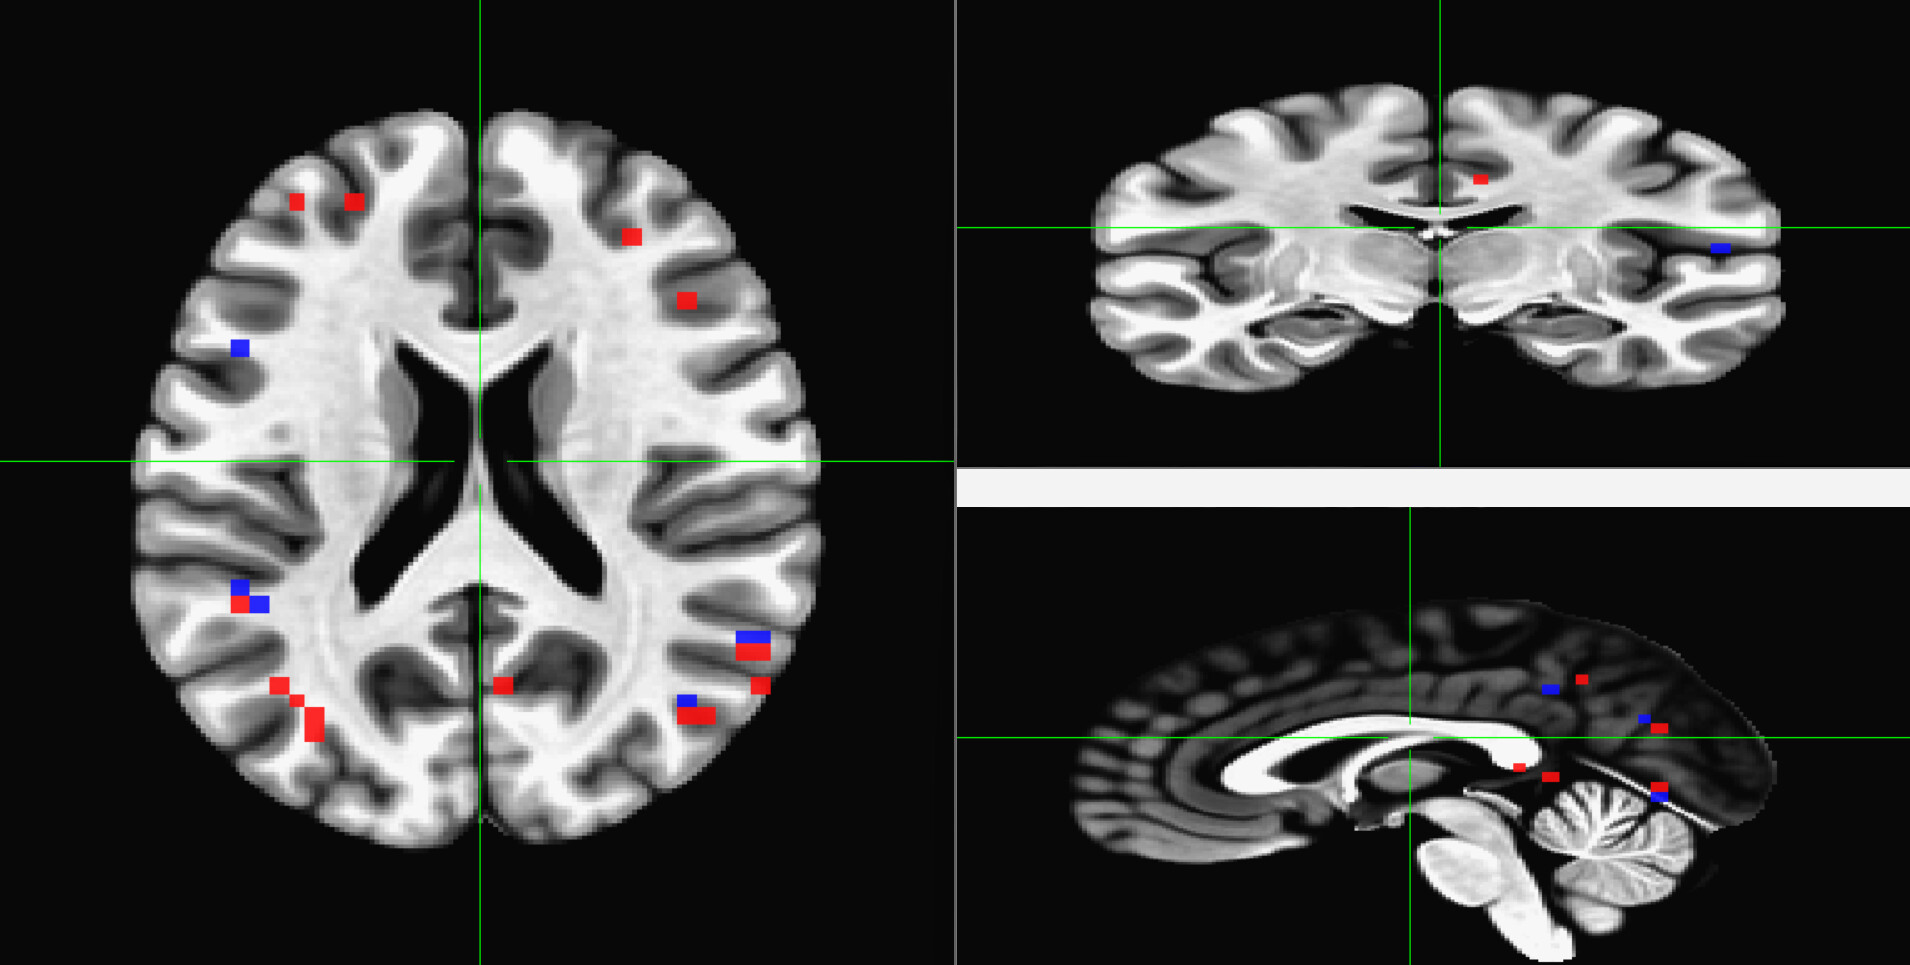
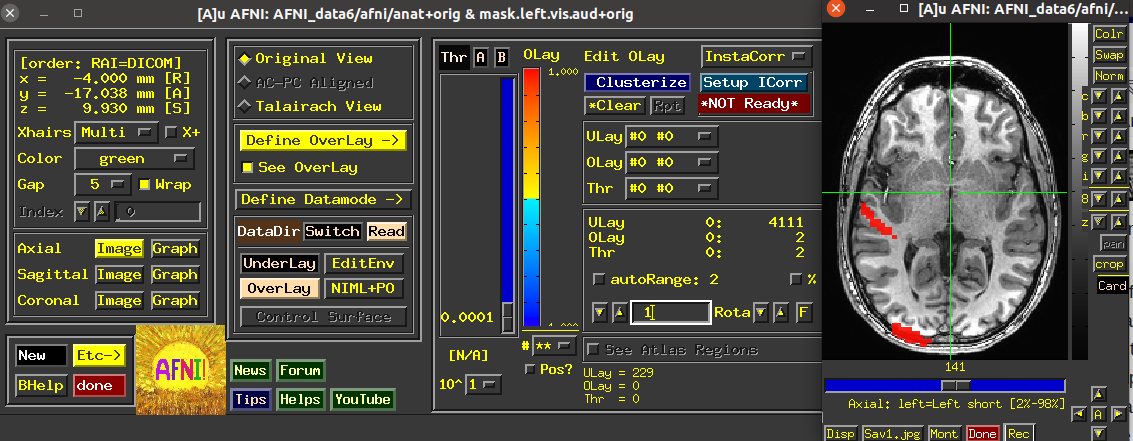
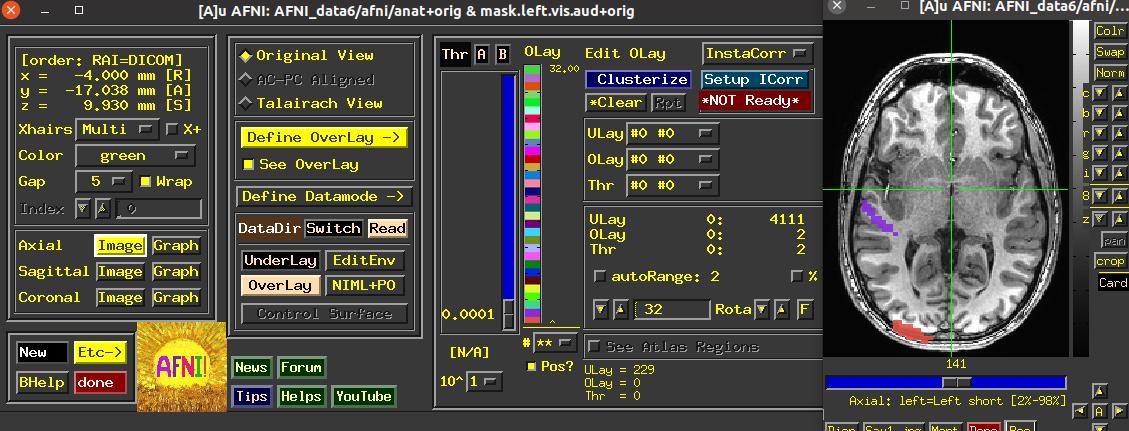
Now after using 3dUndump with these files, and creating a new file that is going to be used in AFNI and then visualized into SUMA with a 2D format so that we can better analyze the patterns, I can only see two of the visual stimuli categories.

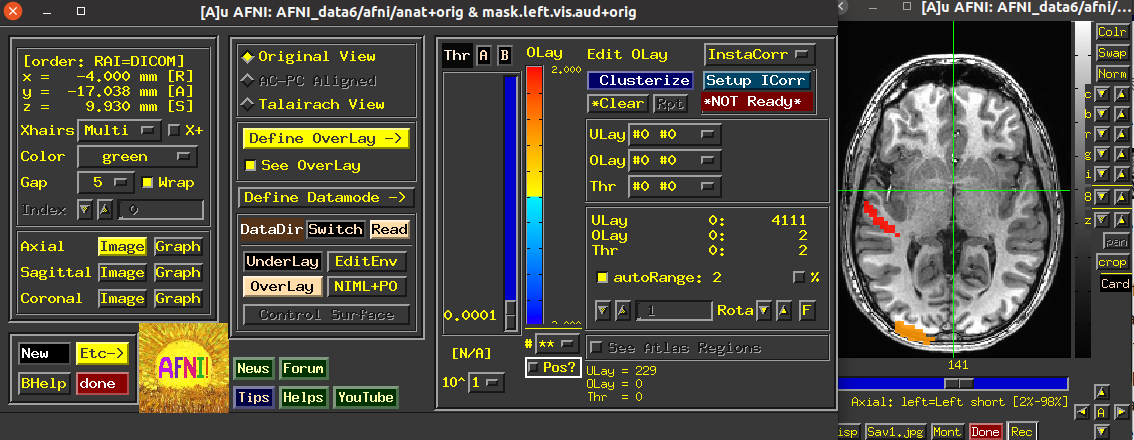
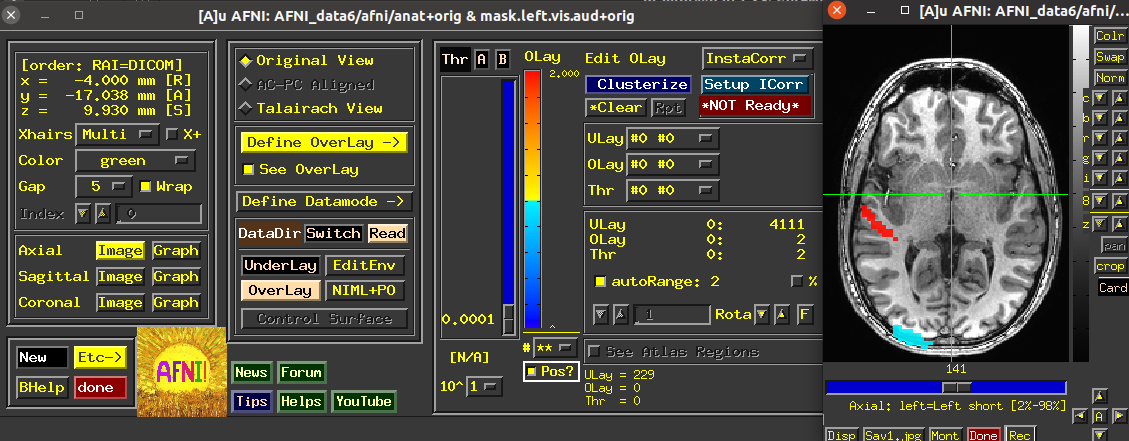
Since the range of the data in AFNI is from 0-3, we are expecting each value (1, 2, and 3) to correspond to a color on the visualization; red, blue or green (we are using the RedBlueGreen colorbar) but I am only seeing red and blue, and am unsure why the other stimuli would not be shown.

3dinfo: AFNI version=AFNI_24.2.01 (Jul 16 2024) [64-bit]
Dataset File: ----+tlrc
Identifier Code: ----
Template Space: TLRC
Dataset Type: Anat Bucket (-abuc)
Byte Order: LSB_FIRST [this CPU native = LSB_FIRST]
Storage Mode: BRIK
Storage Space: 245,760 (246 thousand) bytes
Geometry String: "MATRIX(3.75,0,0,-121.4062,0,3.75,0,-108.2812,0,0,4,-40):64,64,30"
Data Axes Tilt: Plumb
Data Axes Orientation:
first (x) = Right-to-Left
second (y) = Anterior-to-Posterior
third (z) = Inferior-to-Superior [-orient RAI]
R-to-L extent: -121.406 [R] -to- 114.844 [L] -step- 3.750 mm [ 64 voxels]
A-to-P extent: -108.281 [A] -to- 127.969 [P] -step- 3.750 mm [ 64 voxels]
I-to-S extent: -40.000 [I] -to- 76.000 [S] -step- 4.000 mm [ 30 voxels]
Number of values stored at each pixel = 1
-- At sub-brick #0 '#0' datum type is short: 0 to 3

Hurray for fairly helpful advisors!

Is the question: why are you seeing only red and blue when you have 3 nonzero values in the data, namely 1, 2,3? If so, my return question would be: what are the lower/upper values of the colorbar?

Consider the three following screenshots, which differ only in cbar ranges; there are 2 nonzero values here, 1 and 2. The default colorbar is not the best for this kind of visualization, but it should be fine.

By default, AFNI will show a cbar range from -X to +X, where X is chosen automatically in some way. Here, X=2, so everything above zero is a "hot" color, and the ROI #1 is orange and ROI #2 is red:


NB: through a quirk, on some systems the lower value is a bit obscured, but if it were 0 it would just be a single digit.

You can select the "Pos?" button on (see beneath the colorbar), so that the cbar range goes from 0 to X (i.e., only "positive"). When X=2 still, then the ROI #2 is red still but the ROI #1 is just blue now:

You can change the range deselecting "autoRange: ...", which is just to the right of the base of the colorbar, and choose a new max if the given one isn't appropriate. Here, I made it 1 by typing that in just below that de-selected button---it's not that I think this is a good value, but it is different, and now you see both ROIs are red because they are >=1:

You can change the colorbar to something more integer-value appropriate. To do so, right click on the colorbar itself and select "Choose colorscale". I did that here and scrolled down to ROI_i32, which has 32 colorbands. The maximum colorbar value should automatically jump to 32, and I think Pos? should go on (if not, you like want to set it to on). The result looks like this:

So, check your colorbar ranges and things and see if that helps sort out the visualization appropriately.

--pt

That was very helpful - thank you!

I have the proper format in AFNI and this is exactly what I expected!

When it comes to loading this view into SUMA to view it in a 3D space, do I need to create a specific file from the AFNI visual? I see in the SUMA documentation that they loaded the data with -sv, but they only loaded one file into SUMA, but I may have missed documentation that shows opening two files at once.

When I load my file into AFNI, I boot AFNI, select the template MNI to the underlay, and then select the subject data for the overlay. So there is not one single combined file that stores all of this information. Is that something that I should be doing in order to get the proper visualization in SUMA?