I have an array (.mat) of values corresponding to the left hemisphere( right hemisphere as well) of the brain, and I would like to visualize these values on the brain cortex. Could you please guide me on how to achieve this using AFNI and SUMA? I have already obtained all the necessary folders from FreeSurfer, which I believe might be helpful in this process.
Thank you
Are you *.mat file values representing a surface or a volume? You will have to pick datasets that the associate with, and then likely create either volumetric (like NIFTI) or surface (like GIFTI) datasets. This is a nontrivial thing to do, esp. to get all the header information correct, and will require a lot of visualization to verify.
Personally, I don't use matlab, so I am not sure how best to do this. It is often convenient to process with tools that process both data and header information, keeping those pieces together, so there aren't issues mapping the data back to a real dataset that software tools can use. There is "BrikLoad()" in Matlab, and perhaps something analogous for I/O with GIFTI files.
If you are working with volumetric data, then you will need to make either NIFTI or AFNI datasets. Our matlab library or others could be used for that, but you will have to be careful about the header parameters like orientation.
For specific xyz locations, you can place spheres. Again, you have to be careful about the various conventions of coordinates and orientation that we use, which may be different from the one you use in matlab. Connection strength between pairs of spheres are possible too (in the last example).
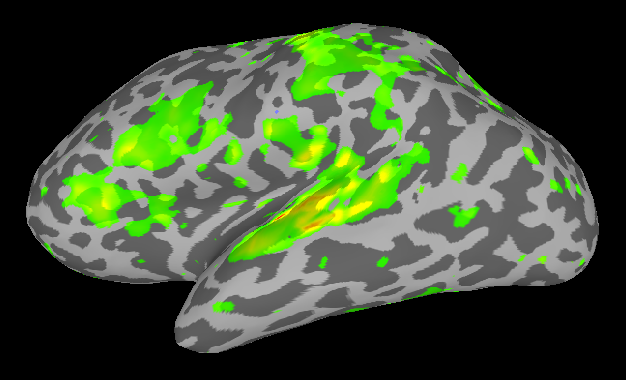
Actually, I want to create figures similar to these. However, I have the values in Matlab. Do you know how I can generate a gifti file from these matrices in Matlab and upload them to SUMA?
I have a matrix (Vertices of left hemisphere, 3).
This matrix contains values for the vertices of V1 and zeroes for other vertices.
Thank you so much
Thank you so much for your response,
How can I upload a Sulci map to a 1D file? I need to do this in order to create the figure I sent earlier. I'm quite confused about this process.
Could you please provide detailed assistance?
Thank you so much.
The
National Institute of Mental Health (NIMH) is part of the National Institutes of
Health (NIH), a component of the U.S. Department of Health and Human
Services.