I am working on a bunch of analysis on a new sequence and would like to compare sensitivity to detection on several measures.
So it would be very interesting to be able to concatenate images with additional data written on the images.
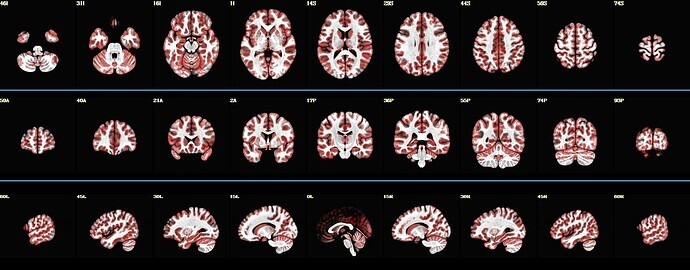
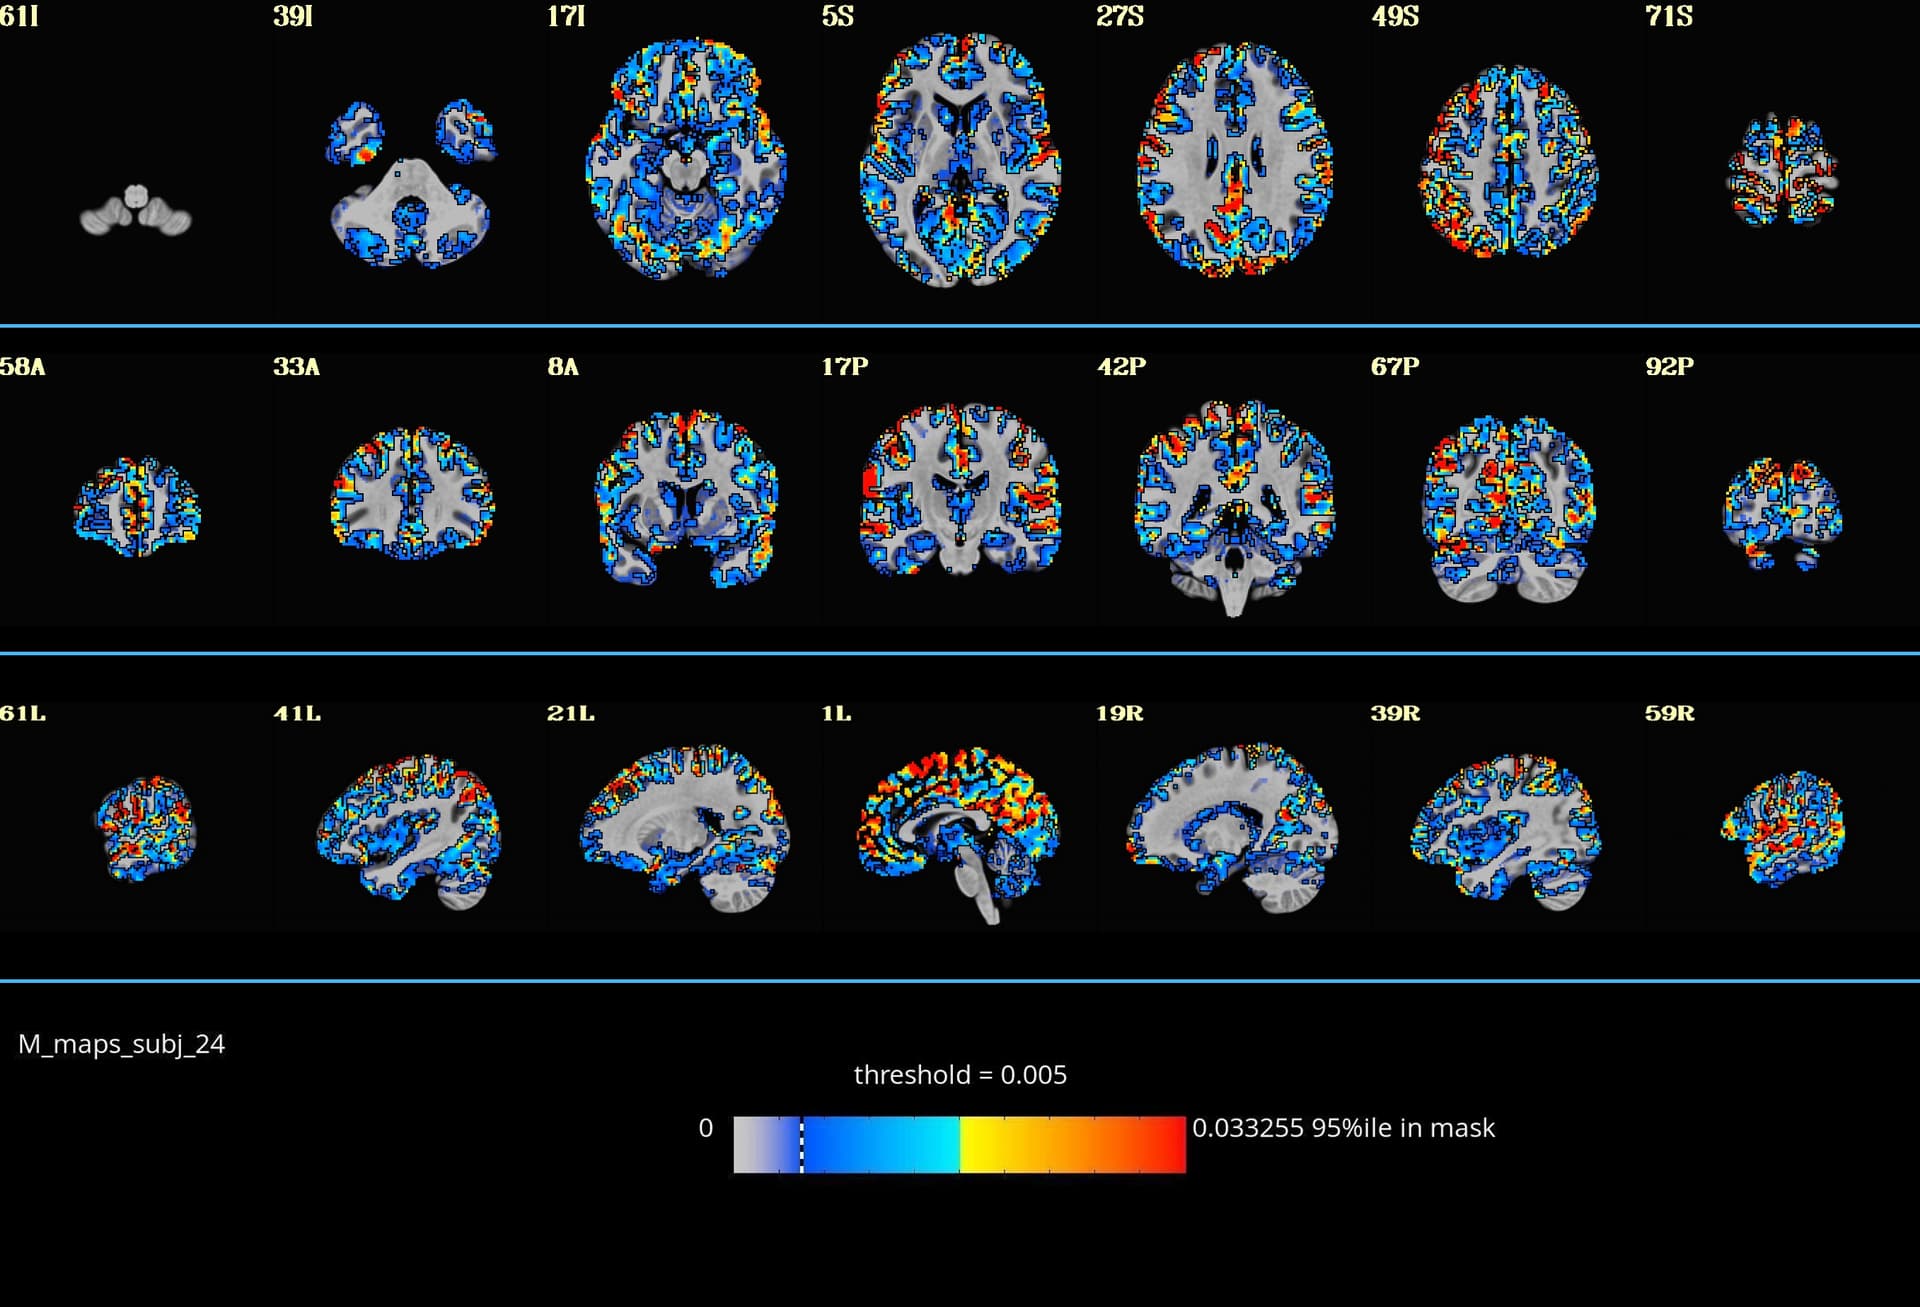
So far, I’ve managed to plot the data, but I would like to add the thresholds and color bar values beneath the images .
I would love to understand how can I script something to make images like such
I have found some new improvements by ptaylor, but I cannot find a reliable way to produce these images.
So far, code below can produce images like displayed below :
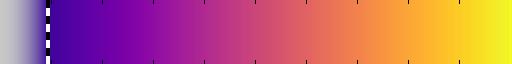
I would love to add the colormaps and relevant informations (is there a gold standard for information to be displayed ?)
Can anybody help/guide me ?
Thanks for any help.
Simon
AFNI version info (afni -ver):
I run Ubuntu 22.04.4 LTS
AFNI Version AFNI_25.2.16 ‘Gordian I’
And Python 3.10.12
I use tcsh scripts and am trying to create a .sh functions to plot the said images
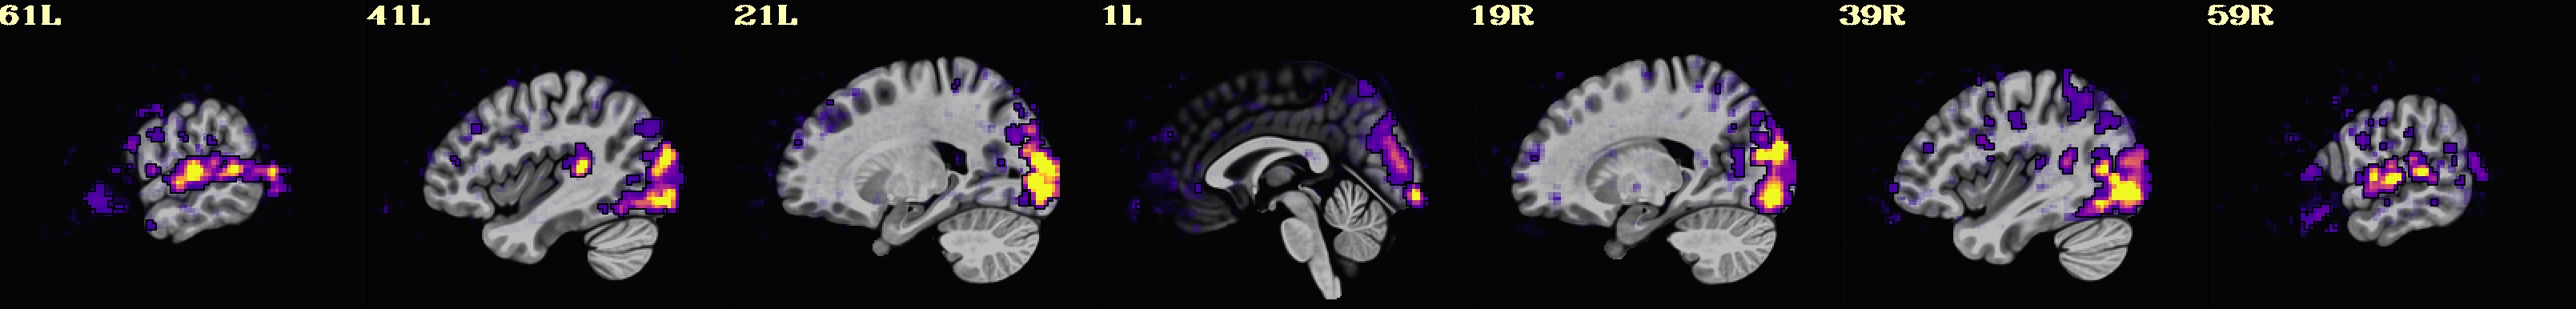
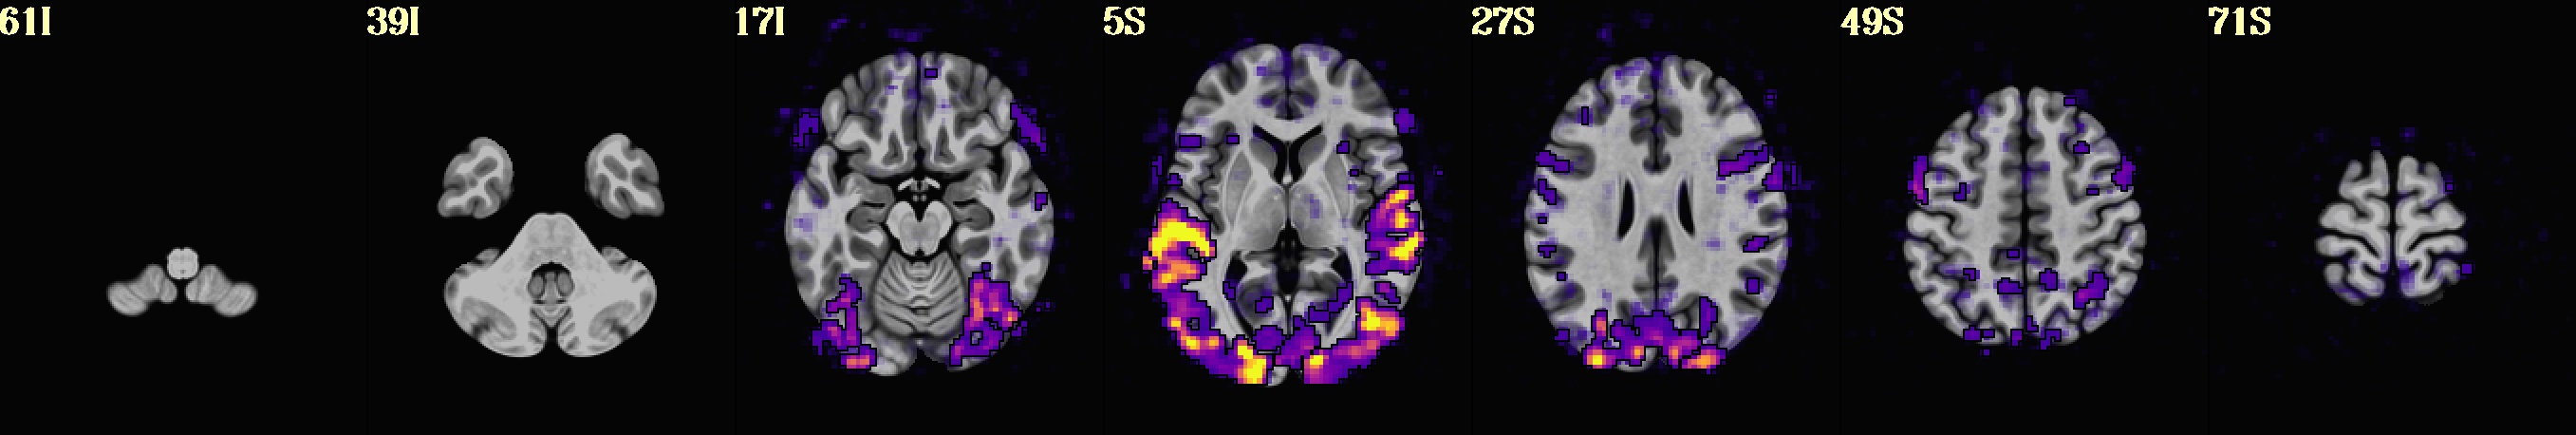
The command used to make the image you pointed to (the full F-stat shown over the MNI template, with transparent thresholding on) in one of the AFNI Bootcamp data processing examples is this:
You can adjust the paths from there, as well as likely the func_range and thr_olay, which come from percentiles within the dset. There are some additional bells-and-whistles there (like the -c2s_* and cmd2script options), but I left those in for no deep reason.
Thank you very much, I was hoping that you might stumble on my post, thank you for your time.
Would this script also enable me to cat the colorbar in the image ?
I have trouble using the colorbar_tool.py function as my @chauffeur_afni does not output any .json file.
Is it regular behavior ?
What it the best way to add the color bar with colorbar ranges and thresholds ?
thanks again
P.S : indeed I posted in two different websites to be sure to reach relevant people.
Shall I trash the one on neurostar ?
To set the colorbar ranges and thresholds is hard to generalize. What is your application of interest?
In many areas of hte field, people use voxelwise thresholds of 'p=0.001'. Is that relevant for your data?
Actually, what is your data? Do you have just stats images to overlay and threshold (like here, because this is a Full F-stat; there is no GLM coefficient or beta weight to show), or do you have an effect estimate coefficient plus a stats dataset to present?
--pt
ps: re. other post, it might be worth noting just that the conversation is continuing here.
Thank you for your reply.
My data is related to this pubication : Multiband multi-echo simultaneous ASL/BOLD for task-induced functional MRI.
I want to plot the M scaling factor which roughly represents the maximum %BOLD signal change in each voxel. It is calculated from mean and Beta_coef of BOLD and ASL signals.
Being a constructed measure, the threshold I will input will be arbitrary (until I find a good indicator to calculate a threshold).
What I usually do is pick a subject, view the data on AFNI GUI and apply the thresholds and ranges read from the GUI to all other subjects in my script.
As I have several measures (3 per subjects) and it is a group study, I want to create the images dynamically.
In order to do so I would like to be able to dynamically add all these information (subject number, thresholds and range) on the plot, around a miniature of the colorbar.
So I was wondering if there is a way to plot the brain maps and these information through an AFNI script ?
Is it only possible through html ?
That all sounds good. Indeed, that is the strategy I would employ to make systematic images that I could flip through---first starting in the AFNI GUI to see what I would want to do, and then translating that to an @chauffeur_afni command to be able to across all datasets.
To this question: So I was wondering if there is a way to plot the brain maps and these information through an AFNI script ? Is it only possible through html ?
Well, if you are referring to the way that descriptive text and colorbar values are placed around, then yes, I think the HTML layer would be one way to go. There isn't a very native way to do that at present. With a view toward automating more parts of figure-generation, I'd pondered wrapping the text-around-colorbar aspect, but I haven't gotten to that yet---so many little things to consider like scaling sizes, etc.
So, at present, I visualize the chauffeur images (or the 2dcat-concatenated ones) as a set and flip through them in a computer application like "eog" on Linux or "open" on macOS. That works well for seeing a lot of them, and being able to regenerate them. And if the colorbar, ranges and thresholds are all constant, then I just need to see those once anyways. To generate figures, I put the images into a libreoffice ODP along with the generated colorbar, and then add the text there for a figure.
This is great, thank you very much for your help.
Your method is similar to what I've been doing so far. It would be nice to have it automated but I guess it is a lot of work.
I think these explanations could help other people understanding how things work too.
FWIW after creating brain and stats-on-brain images with @chauffeur_afni, i sometimes use ImageMagick to add text directly to an image itself. such a command might look something like this for a recent ImageMagick install:
magick input.jpg -pointsize 30 -fill red -annotate +20+30 "Your Text Here" output.jpg
which in this example adds the string in the upper left image corner.
Thank you so much, I think this is exactly what I was looking for !!!
This is perfect, it's really much better to launch a script and check the images without fiddling with it.
Should we consider using this dynamically in @chauffeur ?
Or is Imagemagick too versatile ?
So I'm nearly achieving xactly what I want, but I have trouble defining the sizes in 2dcat.
I can't keep the original size of the colorbar_modified.jpg, 2dcat resizes all images to the same ratio.
Is there a way to keep the images sizes in 2dcat ?
Is there a linux function that might just do that ?
2dcat's functionality will require a final rectangle, I believe, in the final output. And personally, that image looks nice and clear to me, as displayed.
But I understand about wanting to preserve the sizes of a given row, too. If you would like to have the relative size of each panel preserved rather than stretched, you could basically ask 2dcat to pre-pad each image before gluing them together with -respad_in ...
In the example case I have made here, the pixel dimensions of the 3 images were: 3584x512 , 2614x512 and 2614x512. (I found this out by using eog .. to view them from the command line, then in the GUI viewer that pops up I right-clicked and selected "Properties" to see the image size.) So, I figured if I pre-padded each image to the dimensions of the largest, that should preserve the relative size. It is not required to be the dimensions of the largest image, I just thought that would be convenient
Thank you very much for your advices.
I think I have everything I need now.
I hope this can help others too.
Thanks
--sb
The
National Institute of Mental Health (NIMH) is part of the National Institutes of
Health (NIH), a component of the U.S. Department of Health and Human
Services.