Hi-
To post code, it is better to copy+paste text and to put it within backticks, as described here. This will help us (and others) read it and/or copy+paste it ourselves, if need be.
To your question about processing, it would be better if you could please copy+paste your afni_proc.py command, so we can understand what processing pipeline you set up for FMRI with AFNI. That is the succinct form for understanding all your processing when using AFNI. I am not sure what the equivalent is with SPM, but if you could do something similar, that would be more helpful.
I haven't seen any of your results, so I don't know what your data is or how you are comparing things, which are key factors. I will just comment on a couple general points that might be useful.
Before doing any comparisons, there is the important step of doing quality control (QC), to make sure that the data are consistent and reasonable for your study goals, and that all processing steps completed successfully. This is described in more detail in the Open FMRI QC Project, for example, see here. There are several articles about QC'ing afni_proc.py results, such as Reynolds et al. 2023, Birn 2023, Lepping et al., 2023 and Teves et al. 2023. There was one group that used SPM, Di and Biswal, 2023, so you might be interested in that for evaluating your SPM data.
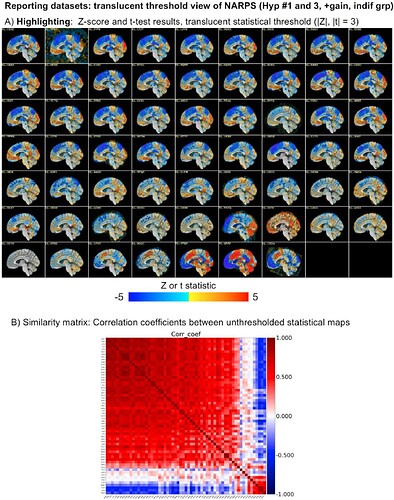
Comparing datasets or processing pipelines has a lot of considerations. The NARPS study was focused on this, where groups processed data using AFNI, FSL, SPM, fMRIprep and more. If comparisons come after thresholding, there can look like many differences in results. However, without thresholding inserted, results across the 60+ teams were actually very similar across the vast majority of teams, regardless of software, just with slightly different magnitude. This was shown in more detail in this paper, in which we looked at the NARPS teams results:
- Taylor PA, Reynolds RC, Calhoun V, Gonzalez-Castillo J, Handwerker DA, Bandettini PA, Mejia AF, Chen G (2023). Highlight Results, Don’t Hide Them: Enhance interpretation, reduce biases and improve reproducibility. Neuroimage 274:120138. doi: 10.1016/j.neuroimage.2023.120138
See for example Fig 8 from there, showing both the same slice across all subjects and the similarity matrix:
The vast majority of subjects have the similar positive/negative modeling pattern across the brain (big red square in the correlation matrix); the bottom red square is actually just teams that made a processing mistake or a different sign notation and have opposite sign results---but after sorting out that issue they are actually the same as the big red square group. So, in the end there are just a small fraction of very different results, which is not surprising.
You can check out other hypotheses and things from that paper---the results remain quite similar. The main less from this should be be careful how you do your meta analyses and how you look at your data. Inserting thresholding can/willl heavily bias you toward accentuating differences and reducing reproducibility. The NARPS study shows the challenges of meta analyses and how difficult/subtle they can be. The Highlight, Don't Hide paper/methodology shows simply showing more data in figures and reducing threshold-induced biases in comparisons leads to better understanding.
So, as you start looking at different pipelines, it is good to keep in mind both the need for quality control to check data+processing. Then also please keep in mind the question of how to do fair comparisons that are not biased from the start.
--pt
