Hi AFNI experts,
Is there any way in AFNI/SUMA to visualize only the edges of ROIs, without filling inside each ROI?
Thanks in advance,
Soo Hyun
Hi AFNI experts,
Is there any way in AFNI/SUMA to visualize only the edges of ROIs, without filling inside each ROI?
Thanks in advance,
Soo Hyun
Hi Soo Hyun,
Here's a short script where almost all the action happens in just two steps. If you are careful, you can actually do this mostly in a single 3dcalc command using relative indexing, but I think this is a little clearer and more flexible.
#!/bin/tcsh
# @edgy_rois
# make ROIs edgy by creating dataset of just the edges of the ROI
# usage:
#   @edgy_rois mydset.nii
# output is edgy_rois.nii.gz

set dset = $1
set prefix = "edgy_rois"

# see if voxels are on edge by looking for any differences in a voxel neighborhood
3dLocalstat -stat stdev -nbhd 'SPHERE(-1.42)' -prefix temp_sd.nii.gz -overwrite \
   $dset

# alternatively, use a bigger neighborhood, particularly for anisotropic voxels - thicker edges
#3dLocalstat -stat stdev -nbhd 'RECT(-1,-1,-1)' -prefix temp_sd.nii.gz -overwrite \
#   $dset

# color the edges only by the ROI value
3dcalc -a $dset -b temp_sd.nii.gz -prefix $prefix.nii.gz -overwrite \
   -expr 'a*step(b)'
3drefit -cmap INT_CMAP $prefix.nii.gz
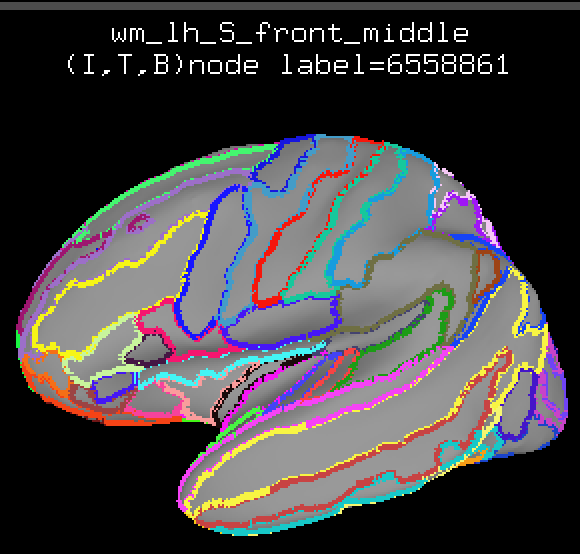
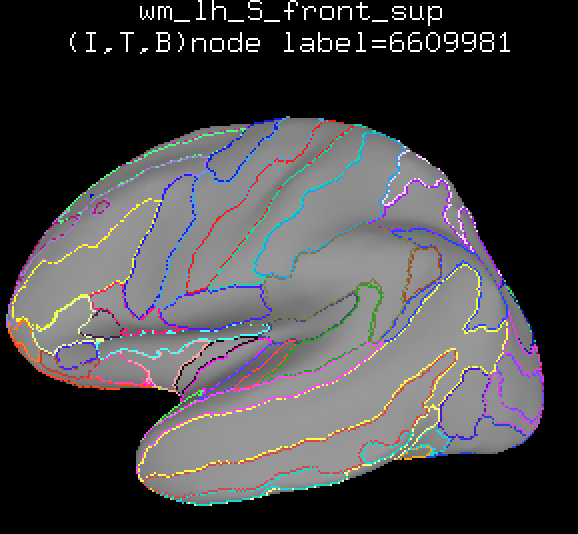
Another tricky way to show edges is to make surfaces of all the regions and then use suma to draw the surface nodes in the afni GUI.
mkdir surfs
cd surfs
IsoSurface -isorois+dsets -input …/myrois.nii -o mysurfs.gii
Then start afni in the volumetric data directory and suma with the surfaces you just created.
afni -niml …/
suma -onestate -i *.gii -sv …/myrois.nii
In AFNI, set the underlay to some desired dataset. In suma, press ‘t’ for suma to talk to afni, and the surface edges will appear in the afni viewer. You can control the thickness of the edge lines with the Control Surfaces menu in afni.
Hi there,
Sorry to comment on an old post, but I have been trying to make a ROI I drew in SUMA more visible (edges thicker/ darker, ideally in black).
I started trying to use the above for my ROI (which is .niml.dset), but then got a nifti_header_version: bad sizeof_hdr: 1094459427 when I tried to run the 3dcalc step, presumably because it was expecting volumetric data?
How would you make a .niml.dset ROI more easy to see while viewing in suma? Is there a way to do this in SUMA alone without talking to afni?
Thank you for your help,
Harriet
You can set the SUMA environment variable, SUMA_ContourThickness. Here, I've changed mine from the default of 1.0 to 4.0 in my .sumarc file in my home directory.
And here's resetting that temporarily on the command line with
"suma -DSUMA_ContourThickness=1 ..."
Thank you so much, that worked!
The National Institute of Mental Health (NIMH) is part of the National Institutes of Health (NIH), a component of the U.S. Department of Health and Human Services.
Freedom of Information Act |
HHS Vulnerability Disclosure
National Institute of Mental
Health | National Institutes of Health | U.S.
Department of Health and Human Services |