AFNI version info (afni -ver): AFNI_26.0.08 (Jan 30 2026) [64-bit]
Hi all,
I used 3dReho to compute Kendall's W values, which I plan to use for group analysis.
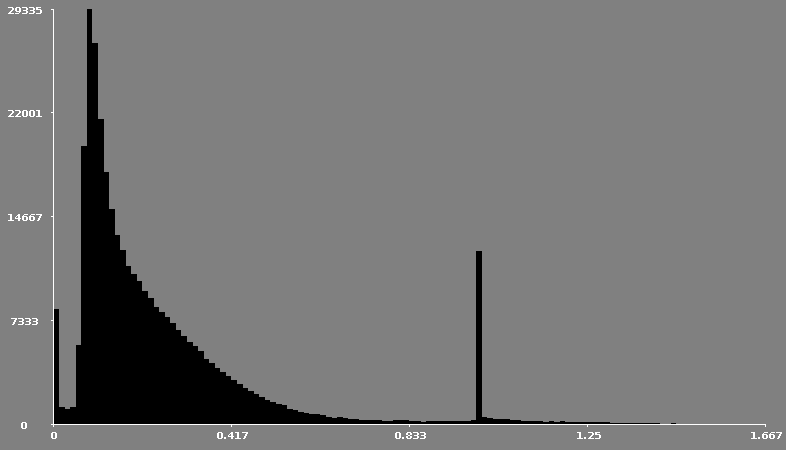
However, upon inspecting the voxel histogram, I noticed that the values are not following a Gaussian (normal) distribution but rather an F or Gamma distribution.
Can you recommend a procedure to transform the data?
Thanks,
Philipp
Hi, Philip-
Kendall's W indeed are not Gaussian. The values are restricted to being in an interval [0,1]. I don't know of a way to fully convert this to Gaussian, which is in range (-infinity, +infinity).
For Pearson r, which is in range [-1, 1], the Fisher transform does this, and it can be written in two ways, using either the natural log or inverse tanh functions:
- Z = atanh(r)
- Z = 0.5 * ln(1+r)/ln(1-5)
I guess you could use a similar transform to try to approximately convert W to a "half Gaussian", like Z=atanh(W), etc. You could use 3dcalc to do this:
3dcalc -a DSET_W -expr 'atanh(a)' -prefix DSET_KindaGaussian
Is that appealing?
--pt
Hey Paul!
It kind of is 
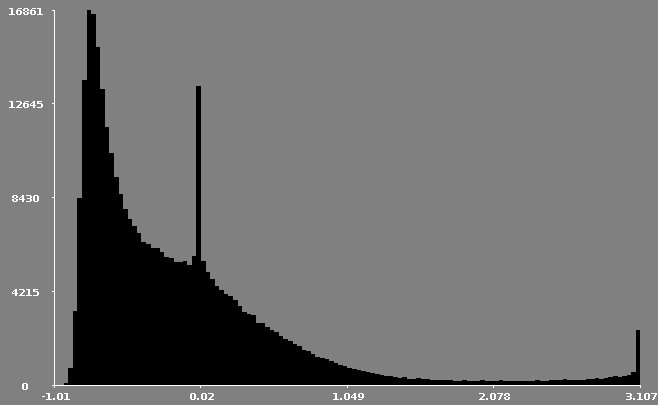
If I do it this way, the histogram looks like this:
Is that fine for group analysis?
I also tried a spatial z-transform using -expr "b * ((a - $MEAN) / $STD)", where b is a brain mask.
The histrogram looks not sooo much different though:
Not sure what the best way forward is with those histograms being similarly appealing.
Bests,
Philipp
Hi, Philipp-
I guess I would just stick with the more well-known arc-tanh transform.
That big single peak around 0.9-something (or is that at exactly 1?) is a bit odd to see. Do you know why that is occurring? Is it something with masking, perhaps, where there are are uniformly equal time series, perhaps due to constant values? It just seems a bit artificial in that distribution.
--pt
Hey,
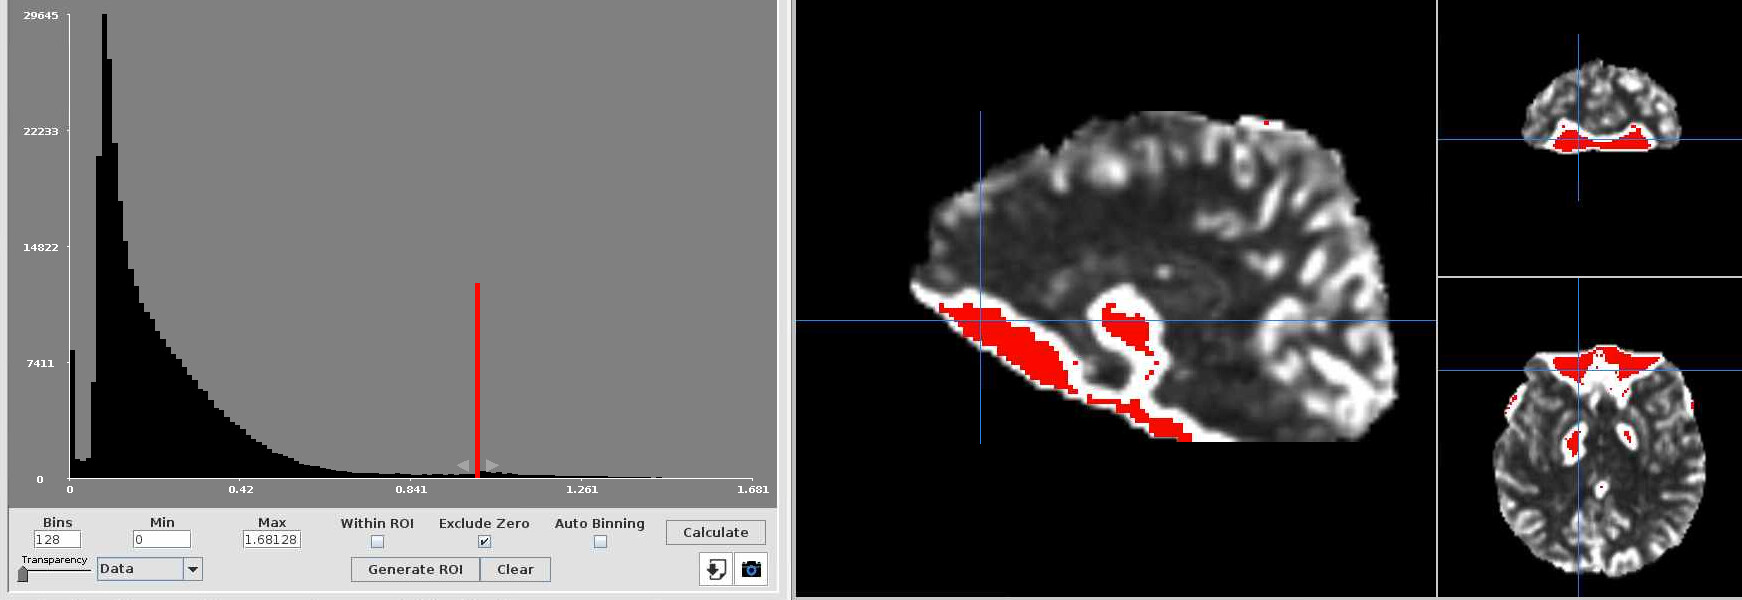
yes, you are right! There are voxels with the exact value 1 and are located in specific parts of the brain:
I will try to wrap my head around that, but I believe that you are correct that this value reflects constant activity.
Hi, Philipp-
Are those voxels perhaps saturated (so, like value=4095) and therefore constant?
Note in the afni_proc.py QC HTML, that would be checked for automatically during processing, and shown in the 'warns' section, for known saturation values. Well, 4095 might be the only one checked for. It would look something like this if there were no saturation found:
... and then it would look non-green and more ominous if saturated time series were found.
--pt
Hi Paul,
apologies for the late response!
I am not sure that I follow. The ReHo data set is based on fmriprep/tedana preprocessing with additional 32P denoising and filtering
3dTproject -overwrite -input $input -prefix FilteredDenoised_bold.nii.gz -dt 2.1 -bandpass 0.009 0.08 -polort 0 -ort nuisance_regressors.1D
and then I blurred the image with 3dBlurInMask and finally
3dReHo -overwrite -prefix ReHo_raw.nii.gz -inset $input -mask $mask -nneigh 27
and transform the data as shown. How can I use afni_proc to check for saturation?
Bests,
Philipp
Checking for saturation is one of the automatic checks in the APQC HTML.
If you aren't using that, you can check the min/max ranges on your raw data EPI datasets, before any processing has been done.
--pt
Since afni is super specific, i.e. showing information for each voxel, would I have to do the min/max ranges for each voxel per volume or would it suffice to look at the min/max range per volume? What would best represent saturation effects?
Bests,
Philipp
Sure, AFNI does lots of things, so you can find the necessary information.
We are talking about getting min/max values across the dataset.
In this case I would do what afni_proc.py would do (which I saw by checking out proc.* script), which is based on running this command:
3dTto1D -method 4095_warn -input DSET
You can also use 3dinfo or 3dBrickStat to get min/max values across the dataset. That might be useful because I don't know what scanner you used, which might have a different saturation limit, and it would be worth checking the min/max directly still.
# min/max values stored in header, across all volumes, not applying any scaling factor
# NB: we don't want a scale factor applied, because the question is more about the
# saturation of the "raw" numbers themselves
3dinfo -dminus -dmaxus DSET
--pt
Thanks, Paul.
I ran the command
3dinfo -dminus -dmaxus DSET
on my data sets. For context, the data was acquired at a 7T Siemens scanner (not the new Terra yet :) ).
And the output is indeed 0 and 4095! Is that surprising and/or a good sign?
Bests,
Philipp
I suspect that is a bad sign...
Try running:
3dcalc -a DSET -expr "ispositive(a-4094)" -prefix MAP_OF_4095.nii.gz
... and see where/how many voxels that is. I suspect it will correspond to that flat region.
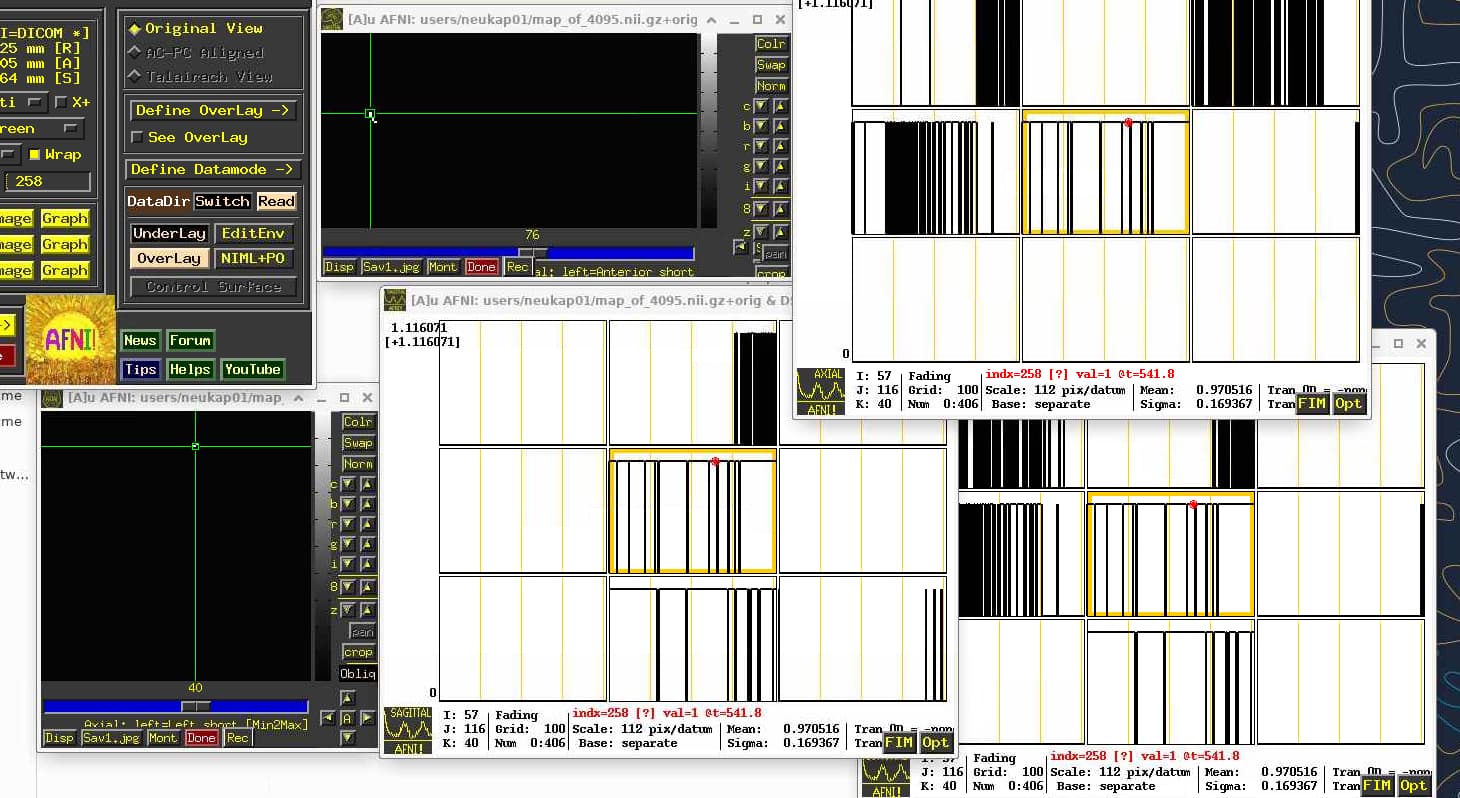
NB: you will need to check it over time. I suspect if you look at time series in those regions (like, open the dset in AFNI, hit "Graph" and navigate to some of those locations), you will see the time series be fluctuating and hit a ceiling, at 4095.
--pt
Just to chime in, @philippn if you want to avoid 4095s in the future, you can adjust the scaling factor at the Siemens console. Ask your tech about it, and if they don't know no worries, I'll look it up and post directions asap I'm just not at the scanner atm.
1 Like
Thank you, that would be great! I am still trying to understand why 4095 is so bad and how it can be avoided in the future, so whatever you can share to resolve this, I'll take it
Bests,
Philipp
I am attaching a snapshot of the computed map:
I am also happy to share the nifti with you, if that is more helpful.
Bests,
Philipp
Hi, Philipp-
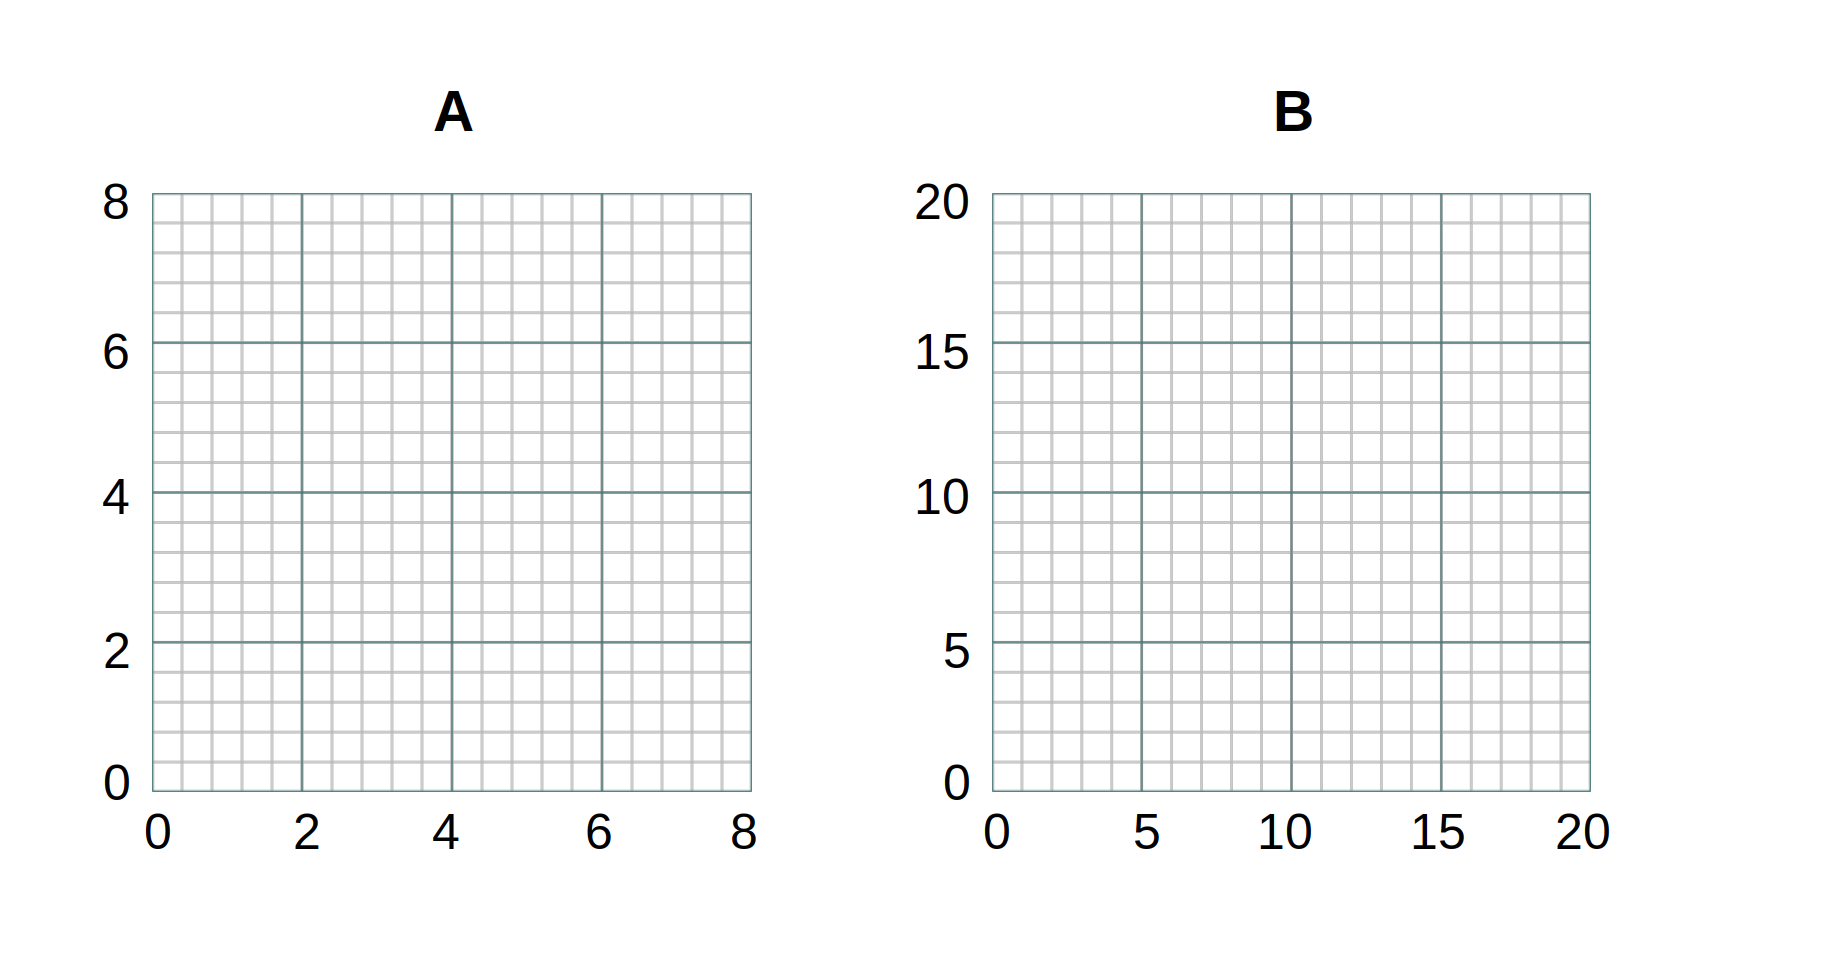
Imagine you have to do a science project that involves measuring some information, and you have to use one of the two graph papers here to do it, where you can only make marks on the graph lines:
Paper A has finer resolution to record data in more subtle detail: the line gaps are 0.4, vs in B where they are 1. However, Paper B has a larger overall range of [0, 20], vs [0, 8] in A. So, you have to be able to have some kind of calibration to know what is possible. If you choose Paper A and you have values of 9, 15 and 16 to record, those will
saturate your recording paper, and hence you will lose information---the best you can do is record "8", which is the ceiling value of your recording device. You have lost information.
- As a QC check in this situation, you know if you record a value of 8 at all, you might have been doing so in a way that lost information. (Indeed, "8" could be the real value, but you wouldn't be sure.)
This is a similar situation we face with measured FMRI signal and saturating values. The added consideration is that there is a pre-calibration step whereby the scanner should "choose" a valid scaling for the unitless BOLD measures to record values between the [0, 4095] range that it is allowed on disk. It has to guess what maximum range of values might come in, so it can choose how to map those within the [0, 4095]. If it guesses wrong, and eventually something comes in that would be outside that range, then the best it can do is record that as the ceiling value.
The question for avoiding this in the future is to chat with your scanner tech/physicists and figure out why that initial calibration is not working on the scanner.
--pt
1 Like
Love that analogy, @ptaylor ! As for console setting recommendations, @philippn it may depend on the sequence you're using. We also have a non-Terra Siemens 7T, but we run both product and CMRR fMRI sequences (usually the latter). For CMRR you can go to System > Tx/Rx > "Img. Scale. Cor." and try setting "1" to 0.5". It's sort of like turning down the gain. But there's also an "FFT scale factor" in Sequence > Special. So I don't know which to recommend. Like Paul and I said, I HIGHLY suggest talking to a scanner tech/physicist before tweaking these for human acquisition. Test with phantom first. Nevertheless, hopefully the above will point the tech/physicist in the right direction if they haven't encountered this before.
1 Like
Hi @ptaylor and @storrisi,
indeed the graph paper example really helped getting your point across that some data points may not be sampled properly if the wrong paper is chosen. Thanks for that!
And thank you @storrisi for your recommendations regarding the scaling. I will talk to our MR physicist and see what he has to say about this, although I am still trying to understand the implications of these saturation effects, which is also why it took some time for me to respond.
Just to come full circle to my original problem with transformed Kendall' W distribution and the voxels in the brain that have a constant "1" value as shown in the image above that caught Paul's attention - can that be directly related to the saturation effects? I probably have to check twice, but in the original 4D time series, the 4095-voxels seem to be more diffusely distributed across the brain and not that clusters around the bottom parts of the brain.
And just out of curiosity, how big is the impact of saturation effects on fMRI data analysis in general from your experience?
That would help me building a compelling case as to why that should be really addressed, just in case I am being questioned about practical relevance.
Thanks,
Philipp
Hi, Philipp-
The AFNI GUI is quite useful here. You can underlay your time series from which you calculate ReHo (=Kendall's W), and overlay that ReHo dataset. Threshold your overlay to 0.999 or so, and check out the time series where there is ReHo=1. How do those time series look? Whether they have exactly 4095 values or not (these are your processed data, I think, and are likely in a template space, so they have been smushed around, regressed and regridded), something is very weird there---they must be constant some how?
But the 4095 values in the beginning are highly problematic on their own, unfortunately, even if the ReHo=1 values arise from something separate. The dual effects of having those saturated values are 1) losing information and 2) inserting numerical artifacts/features into the time series.
It is safe to say that these are of very practical relevance.
--pt