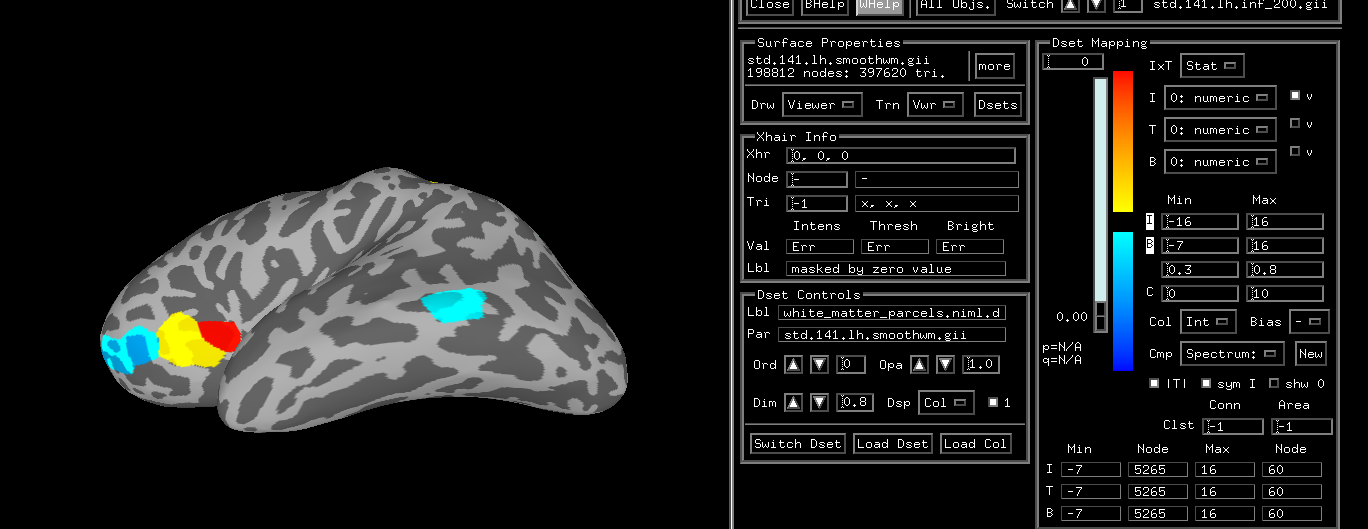
I've created a custom SUMA dset with values ranging from -7 to 16. My goal is to use two spectrums, one from -16 to 0, and another from 0 to 16 to display the scale of the positive values and the scale of the negative values.
In the attached image, you can see that I nearly have what I'm going for, but the white bar that spans both color scales runs from 0 to 16 instead of -16 to 16 and seems to be taking the absolute value of the negative values. To reiterate, I would like 0 to sit at the midpoint between the two color scales.
Any help would be much appreciated, thank you in advance!
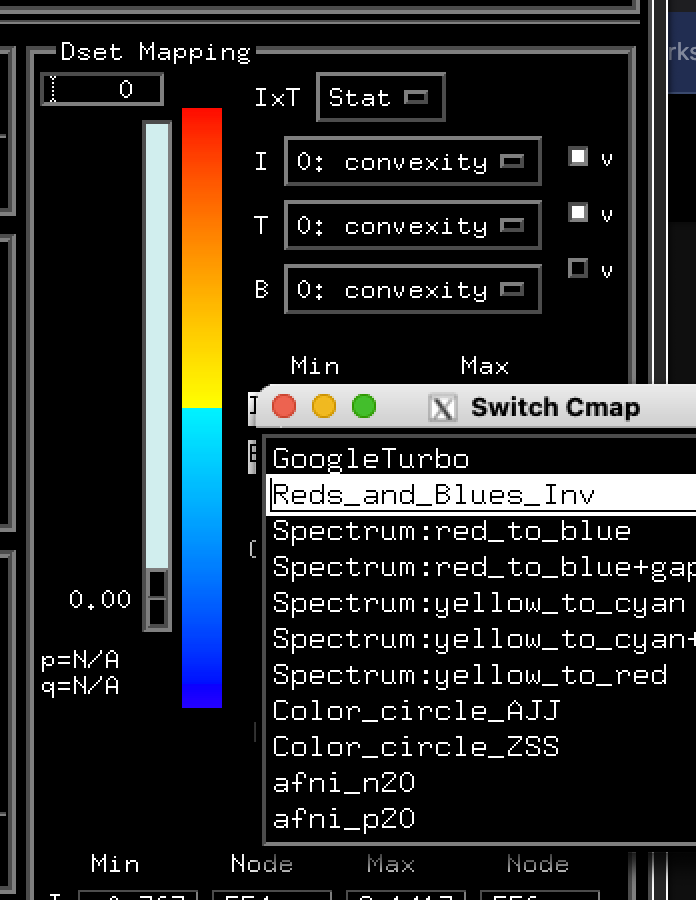
The Reds_and_Blues_Inv also works well, but I'm still finding that my negative values are mapped to positive values, and that the white bar ranges from 0 to 16, omitting negatives. I'm wondering if there is some intricacy in the way SUMA deals with negative values that I am missing? I am using ConvertDset to turn my 1D file into a .niml.dset, and not sure if the sign is getting lost in translation.
What is throwing me off is that the controller is correctly registering the [-7, 16] range in the 'B' values.
Re. "the white bar that spans both color scales runs from 0 to 16 instead of -16 to 16"
Are you referring to the slider bar? That is separate from the colorbar, and that is for setting a threshold value. Thresholds work on absolute values, so that is why it goes from 0.00 upwards. That is a separate consideration from coloration.
The values being mapped for coloration depend on the "I" (intensity) value. Right now, the bottom of your colorbar (dark blue) is mapped to -16, and the top (red) is mapped to sixteen.
I think what you are asking for---positive values with hot coloration and negative values with cold coloration---is pretty common, and should be being accomplished in the current case.
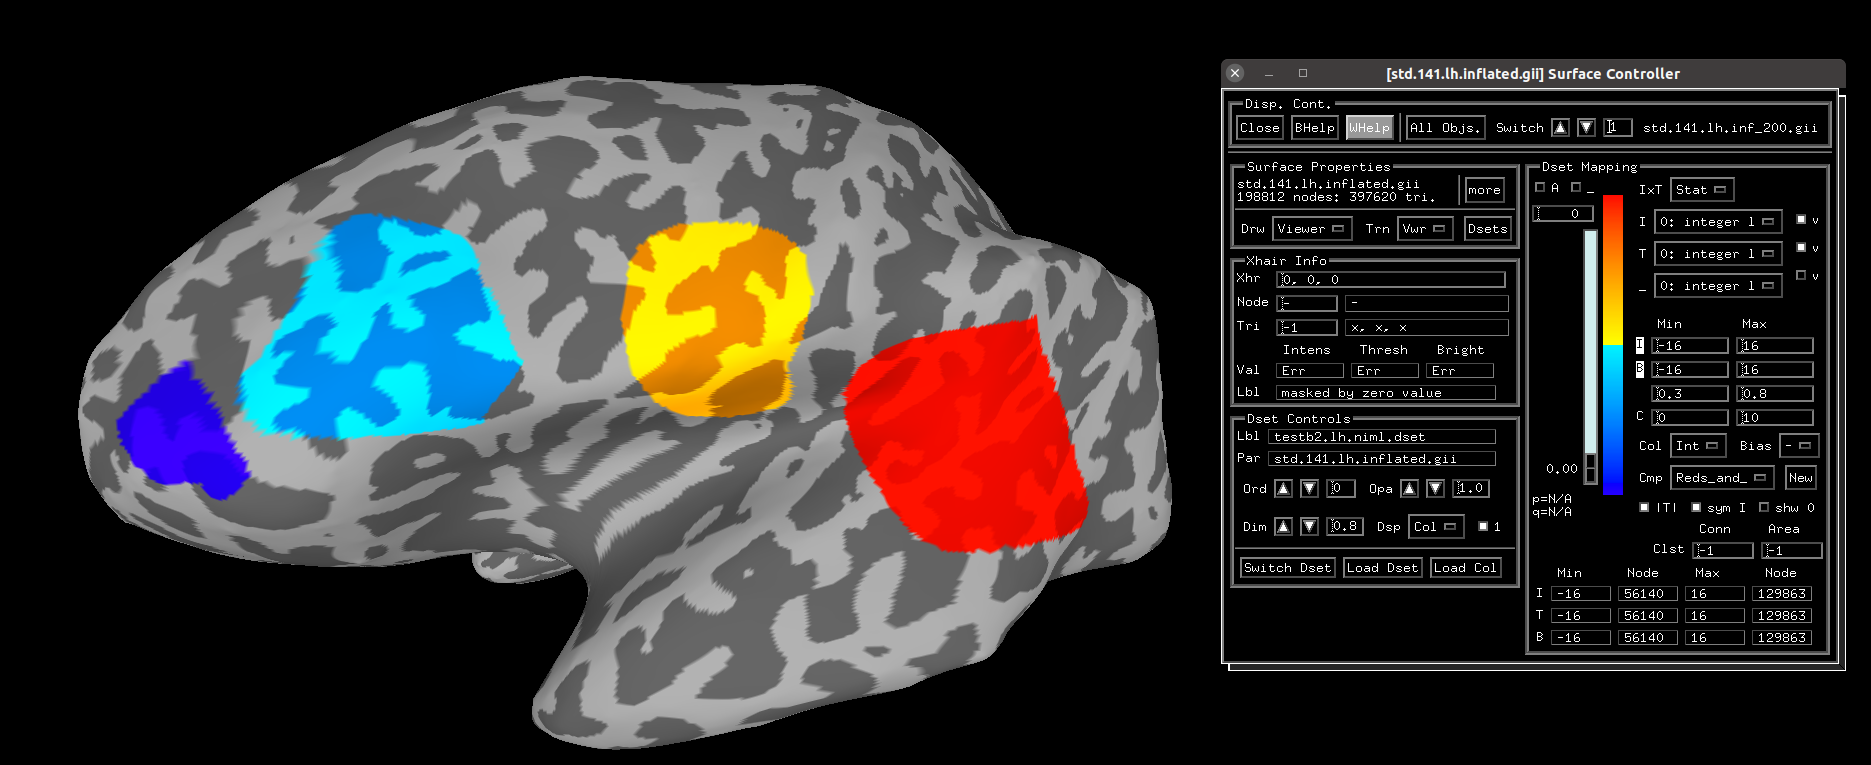
In my image here, I chose the Reds_and_Blues_Inv cmap, with intensity range being -16 to 16, and the ROI values (from left to right) are: -16, -7, 8, 16:
Sure thing, I can see where your question arose. Glad that makes sense.
--pt
The
National Institute of Mental Health (NIMH) is part of the National Institutes of
Health (NIH), a component of the U.S. Department of Health and Human
Services.