Hello,
I have the following question.
To check more thoroughly on the quality of an imaging dataset of older adults, I wanted to look at the “spikiness” of the data, in addition to the usual quality assurance measures like TSNR, enorm, outcount etc.
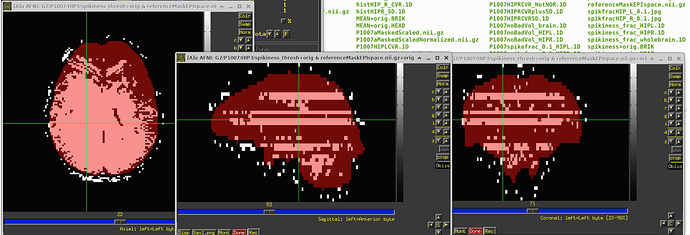
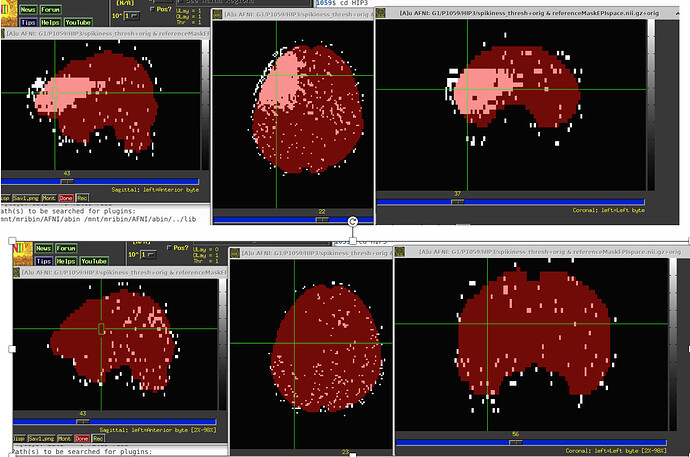
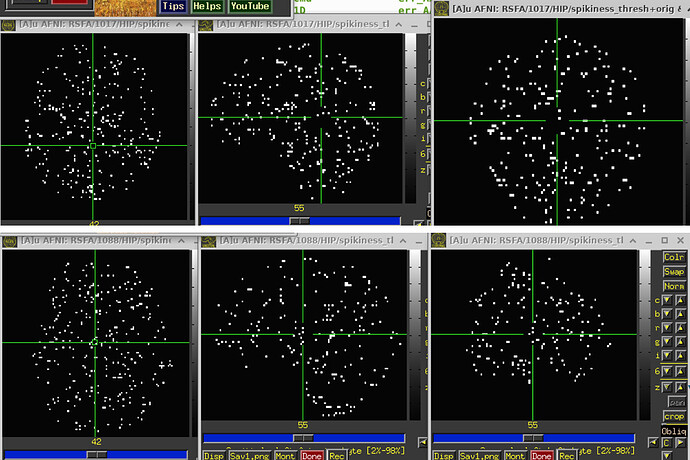
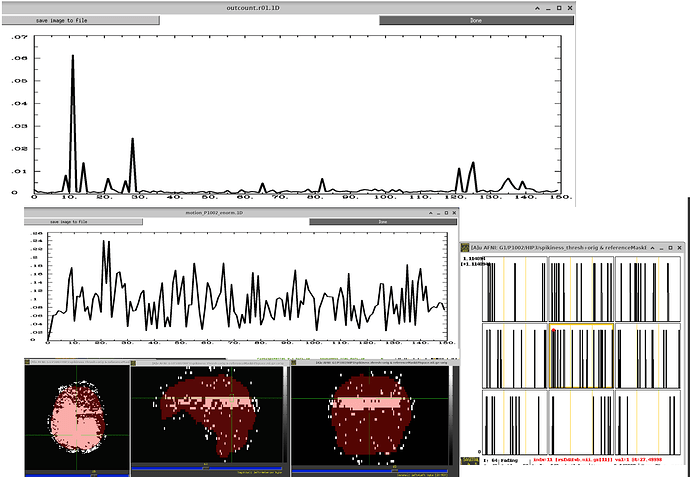
So I ran 3dDespike, saved the “spikiness measure” s from 3dDespike, and thresholded at 2.5. So voxels above that threshold would get ‘1’ assigned, and below that threshold 0. When I then overlapped this data on the imaging data, I found these “bands” in some volumes that go through the whole brain. For some subjects its pretty bad and I see these bands in more than half of the volumes, in others its less (see pictures below). Also sometimes they appear in the same location and sometimes in different locations. I also attached pictures of how the visualization of "spikiness" looks when there are no bands.
Furthermore, I noticed that sometimes the outcount when thresholded at .05 would not pick up on these bands. That means that even when I use enorm and outcount to censor, I would still potentially end up with data that has these "bands". Also, we are specifically interested in the hippocampus and in some subjects these bands go through the hippocampus, which again would have gone undetected if only considering outcount and enorm and not visualizing the "spikiness".
So, my question is:
- Do you guys have any idea what kind of problem these bands might reflect?
- Should't this kind of quality assurance maybe be included in afni somehow? As it seems like its not necessarily detected by outcount.
- Now that I know these bands exist in the dataset I am working with, do I have to exclude a subject for example even when enorm and outcount is below 0.3 and 0.05 respectively?
Any thoughts on this would be appreciated!
Thank you very much !
Carolin
Hi, Carolin-
That is interesting, thanks. That is an interesting check, and one we should investigate further, most definitely (including see what it looks like on "good" data).
Did you run this through afni_proc.py, particuarly:
ap_run_simple_rest.tcsh \
    -subjid    SUBJ \
    -run_ap \
    -run_proc \
    -anat     DSET_ANAT     \
    -epi      DSET_EPI
? That would allow for some other checks and interactions, and I would be particularly curious to see if there are slice-based correlation artifacts, either in the corr_brain QC or using InstaCorr. I also wonder what hte radcor images will look like. That QC directory would be shareable, usefully, too.
Was this data acquired with multiband/slice acceleration? (this might be a potential "blame" factor to consider for Q1)
I also wonder about motion occuring toward the end of the volume TR, because of the slicewise nature of it. If it were a bad coil, I suspect it would be through more planes (well, one of those sets of images might hint at that).
I don't know about whether this will be drop-worthy or not. Let's investigate further first and see what is happening via more angles of checks...
But again, that for mentioning this way of looking at the data!
-pt
Hello Paul,
Thank you very for your quick reply!
Let me answer your questions:
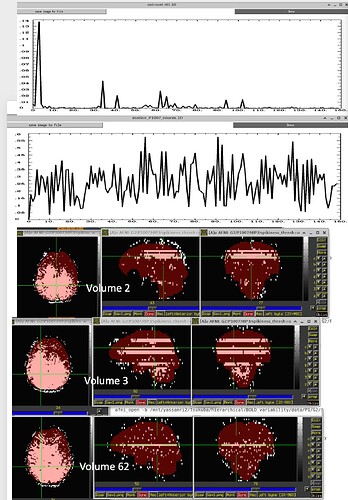
- I also run the steps that I described and visualized the "spikiness" in scans from another site (different hardware and different resting state sequence). I do not see these bands in that data set. Here you can see how it looks in "good data" from this site (2 different subjects) .
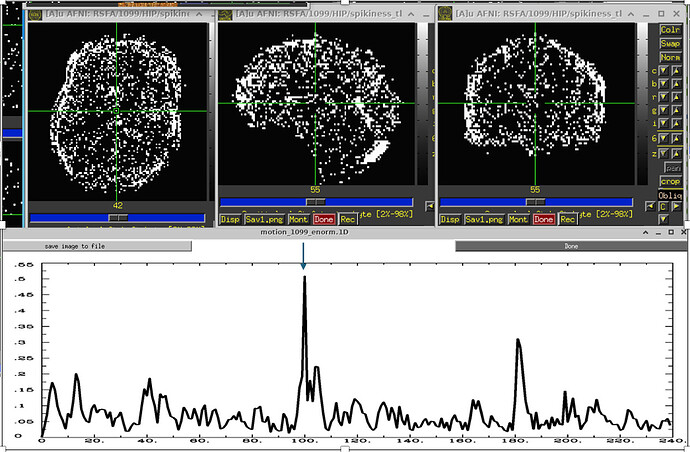
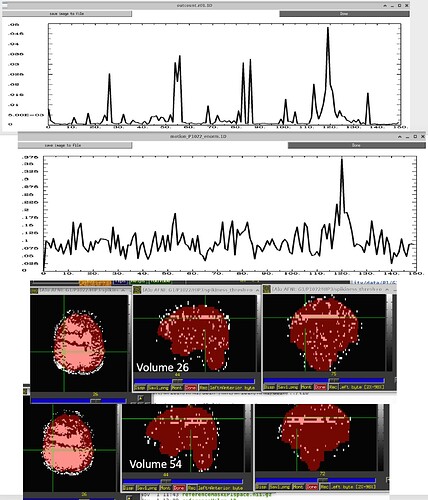
If there is motion, it looks like this:
-
I have not run this through ap_run_simple_rest.tcsh, but now I did. I used exactly the command you wrote. The output are five files: output.proc.P1007, output.run_ap_P1007, run_ap_P1007, proc.P1007 and a directory P1007.results.
What would be the next step? I am not sure what I should be looking for/checking now. You mentioned corr_brain QC and rancor images. Can you give me more guidance on what to do next? I would be also happy to share these files.
-
I am not sure if the scan where the bands appear had multiband/slice acceleration. In the scan card it says: FFE: fast field echo,Cartesian mode and single shot EPI. I can share the scan card too if you want to take a look at it.
-
Based on my data inspection, I don t believe that these "bands" are caused by motion because I found them also in subjects that have a very low amount of motion (at least when looking at enorm). So I would have totally missed that. Again, the 1dplots displaying the outcount would sometimes catch it. But when thresholded at 0.05, sometimes they would not. Here are a few examples:
Hi, Carolin-
Indeed, it would probably help if we could have your raw EPI data, and even the scan card. I will email you about that.
Re. ap_run_simple_rest: Great that you ran this. You should have a QC HTML report in the *.results directory. Move into that directory, and then try running:
open_apqc.py -infiles QC*/index.html
Does the HTML report open up? It is what is described in these papers:
- Taylor PA, Glen DR, Chen G, Cox RW, Hanayik T, Rorden C, Nielson DM, Rajendra JK, Reynolds RC (2024). A Set of FMRI Quality Control Tools in AFNI: Systematic, in-depth and interactive QC with afni_proc.py and more. Imaging Neuroscience 2: 1–39. doi: 10.1162/imag_a_00246
A Set of FMRI Quality Control Tools in AFNI: Systematic, in-depth, and interactive QC with afni_proc.py and more - PMC
- Reynolds RC, Taylor PA, Glen DR (2023). Quality control practices in FMRI analysis: Philosophy, methods and examples using AFNI. Front. Neurosci. 16:1073800. doi: 10.3389/fnins.2022.1073800
Frontiers | Quality control practices in FMRI analysis: Philosophy, methods and examples using AFNI
thanks,
pt
Problems like excess noise in some (but not all) slices can be due to radiofrequency (RF) noise leaking into the scanner room. The MRI raw data is RF signals transmitted by the hydrogen nuclei in H2O. Any external RF signals in the "right" (e.g., wrong) frequency range will contaminate the H2O signals from the body and cause trouble.
To detect if this is the problem, you'll need to talk with the MRI systems engineer or physicist in charge of the scanner. When I was at MCW, the ultimate source of such intermittent noise was discovered to be leakage from the hospital paging system across the street. It could also be caused by some piece of equipment inside the scanner room or by a bad connection at the penetration panel where electronic cables leave/enter the scanner room. Or it could be caused by an intermittent problem in the RF receiver in the scanner (the "receive coil").
In all cases, it is good to look at the echo-planar images from the slices in question. And to scroll through the images in time to see if weird things happen (doing this is quite easy in AFNI). If you can spot some weirdness that happens intermittently (image distortions, or images suddenly turning into pure noise, ...), this can help pinpoint the source of the problem.
Another example: Once, when teaching AFNI in China, there were a pair of grad students from Chongqing who had a couple of FMRI datasets with weird noise issues, spiking included. Looking at the time series of images around the spikes, it appeared as if the slice in question was suddenly "wrong" -- it was not even the right slice, but shifted off. It seemed as if the excitation of that slice was intermittently wrong. Could be an RF or gradient problem -- hard to tell from the images. But definitely not the students' or the subjects' fault.
