Hi experts, I'm back with some more RBA-related questions.
Sample code:
RBA -prefix piper_int -Subj subj -ROI ROI -Y Y 								\
	-PDP 12 1 	-chains 4	-iterations	5000	-model '1+neg+pos+group+sex' 	\
	-distROI 'student' -distSubj 'student' -distY 'student' 					\
	-qVars "neg,pos" -cVars "group,sex" -EOI "neg,pos,group,sex" 				\
	-stdz "neg,pos"								 								\
	-dataTable int_rba12.txt
Question 1. When looking at the output (e.g., int_rba12.txt), the GLM (for reference only) for both cVars are identical, though the region effects (RBA results) are different. We've looked through the .RData file and can't find anything to indicate why this might be the case and were wondering if you had any insight.
===== Summary of region effects under GLM for group comparisons (for reference only) =====
----- level comparison: 1 vs reference level
              Estimate  Std. Error      t value   Pr(>|t|)
L_ai      7.652094e-03 0.004268651  1.792626067 0.07885051
L_amyg   -1.831790e-03 0.005841541 -0.313579916 0.75509457
L_dlpfc   2.743141e-03 0.003623980  0.756941519 0.45250109
L_dstrat -5.901181e-04 0.004510493 -0.130832304 0.89641282
L_tpj    -1.216019e-03 0.004378221 -0.277742660 0.78231122
L_vstrat  3.562937e-03 0.003254751  1.094687956 0.27869810
R_ai      1.198721e-02 0.006427828  1.864893522 0.06784401
R_amyg    2.367073e-05 0.004916675  0.004814377 0.99617712
R_dlpfc   2.620700e-03 0.004191442  0.625250121 0.53454133
R_dstrat -2.057567e-04 0.004407273 -0.046685714 0.96294256
R_tpj    -4.065084e-03 0.005746859 -0.707357625 0.48250250
R_vstrat  4.023793e-03 0.003276190  1.228192614 0.22490484


===== Summary of region effects under GLM for sex comparisons (for reference only) =====
----- level comparison: 1 vs reference level
              Estimate  Std. Error      t value   Pr(>|t|)
L_ai      7.652094e-03 0.004268651  1.792626067 0.07885051
L_amyg   -1.831790e-03 0.005841541 -0.313579916 0.75509457
L_dlpfc   2.743141e-03 0.003623980  0.756941519 0.45250109
L_dstrat -5.901181e-04 0.004510493 -0.130832304 0.89641282
L_tpj    -1.216019e-03 0.004378221 -0.277742660 0.78231122
L_vstrat  3.562937e-03 0.003254751  1.094687956 0.27869810
R_ai      1.198721e-02 0.006427828  1.864893522 0.06784401
R_amyg    2.367073e-05 0.004916675  0.004814377 0.99617712
R_dlpfc   2.620700e-03 0.004191442  0.625250121 0.53454133
R_dstrat -2.057567e-04 0.004407273 -0.046685714 0.96294256
R_tpj    -4.065084e-03 0.005746859 -0.707357625 0.48250250
R_vstrat  4.023793e-03 0.003276190  1.228192614 0.22490484
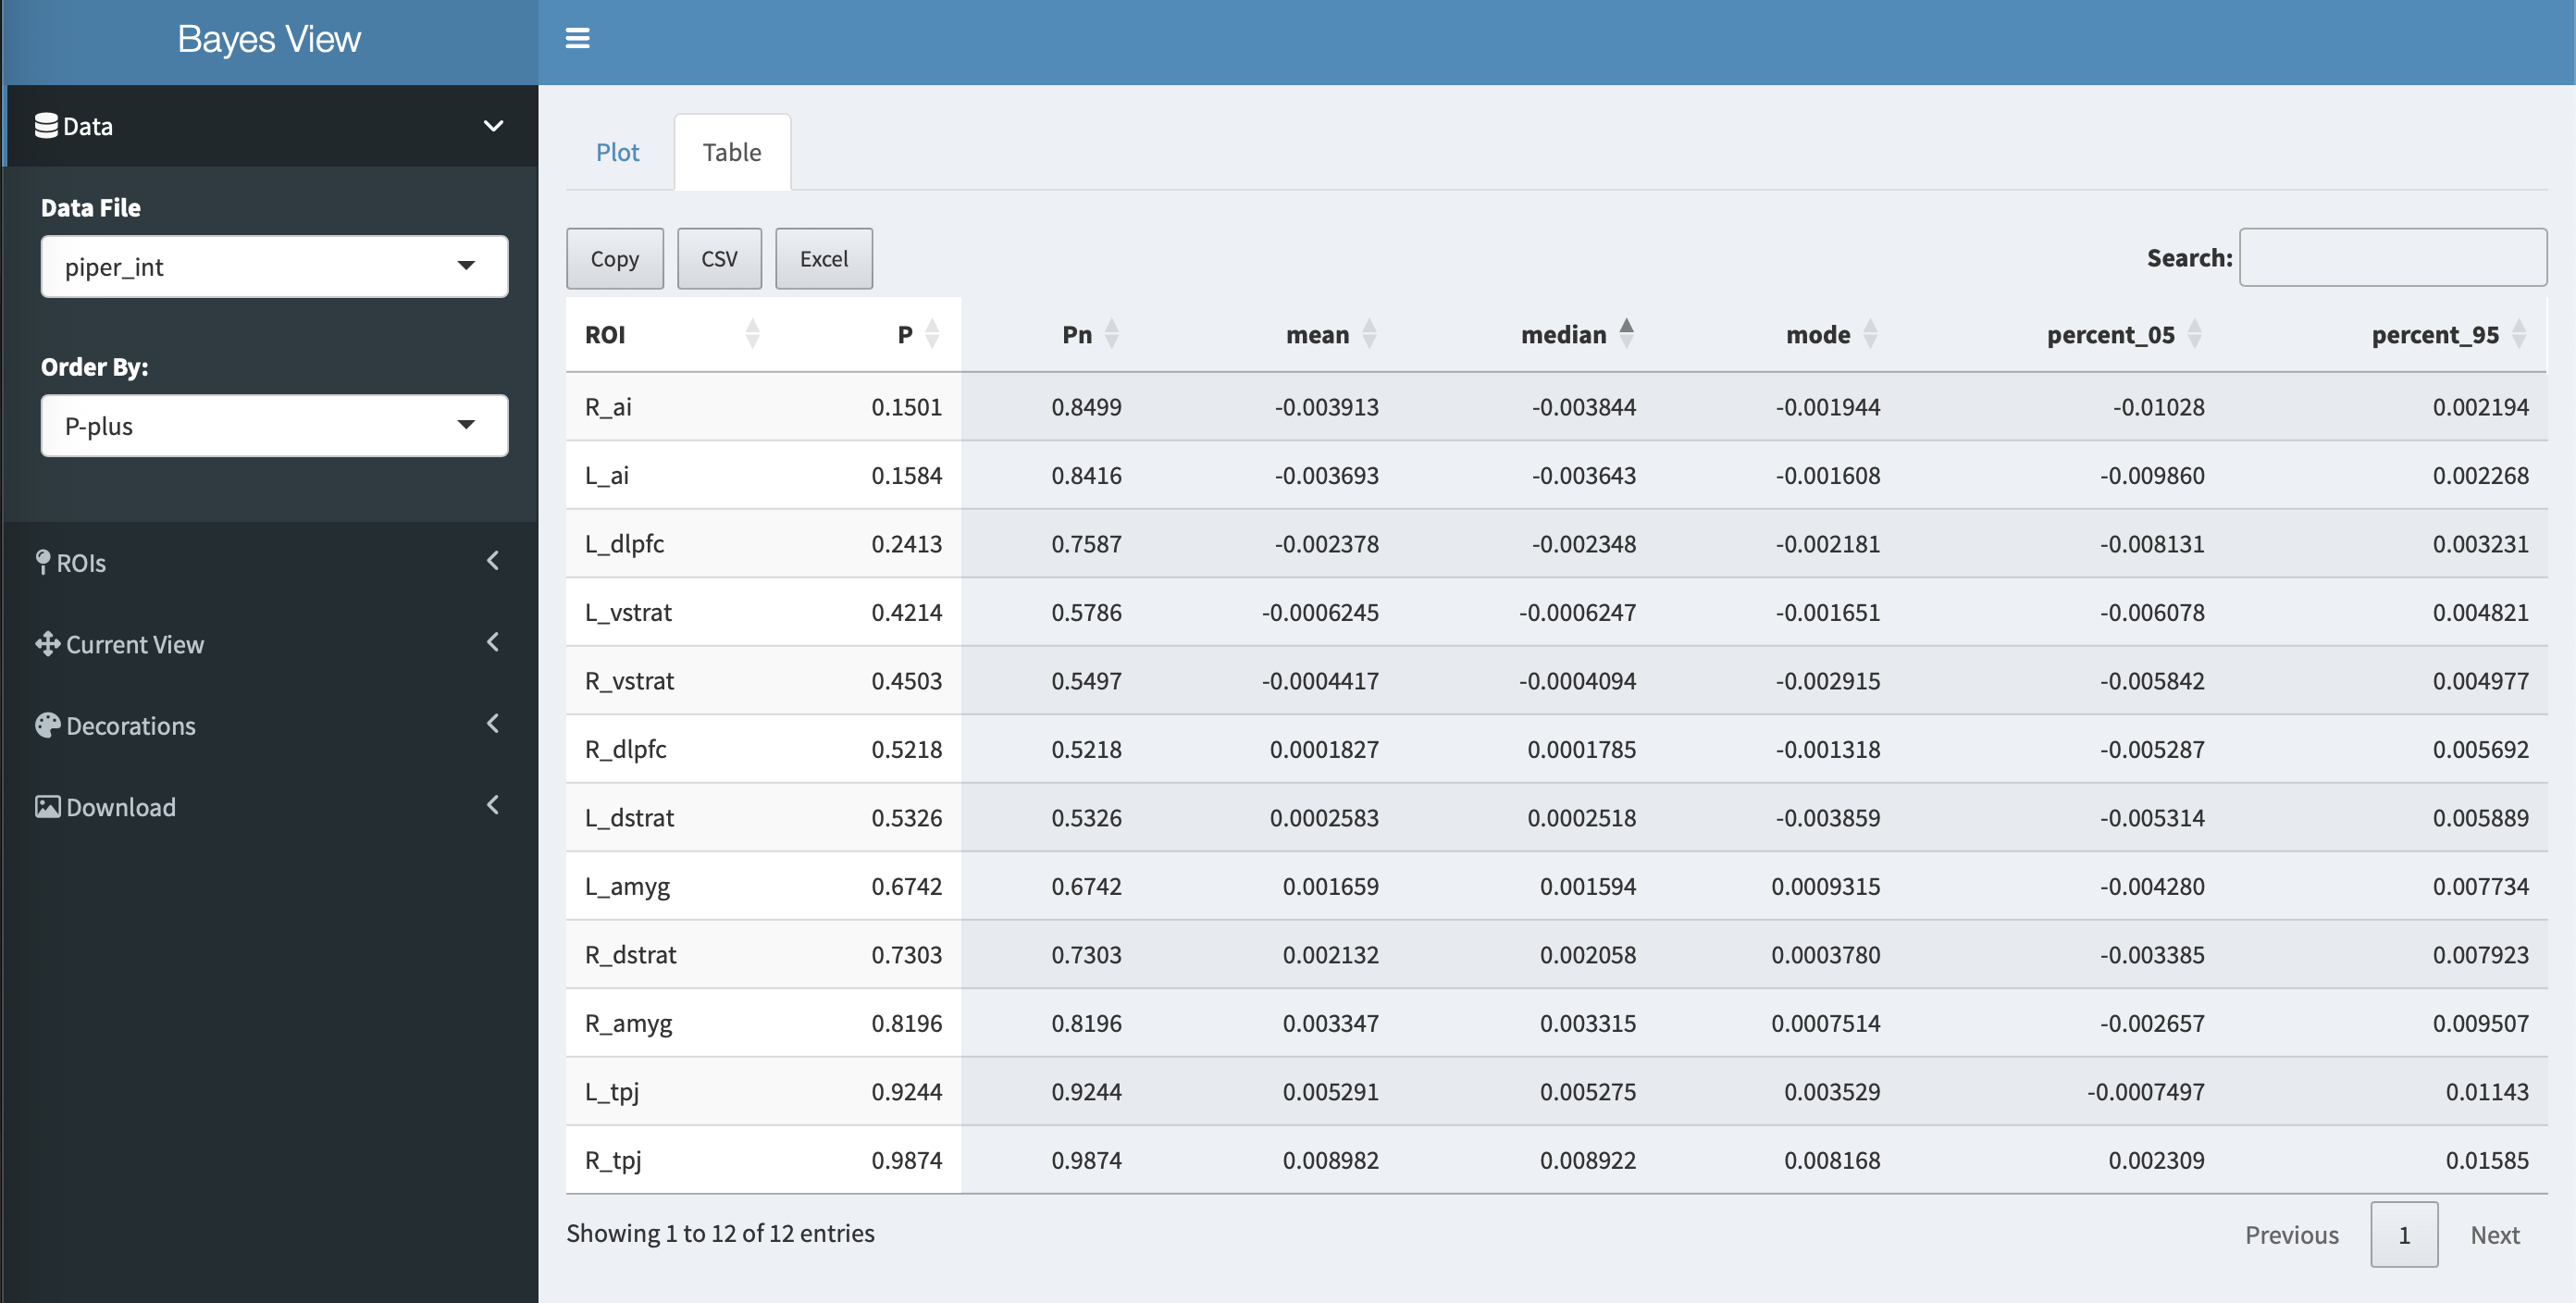
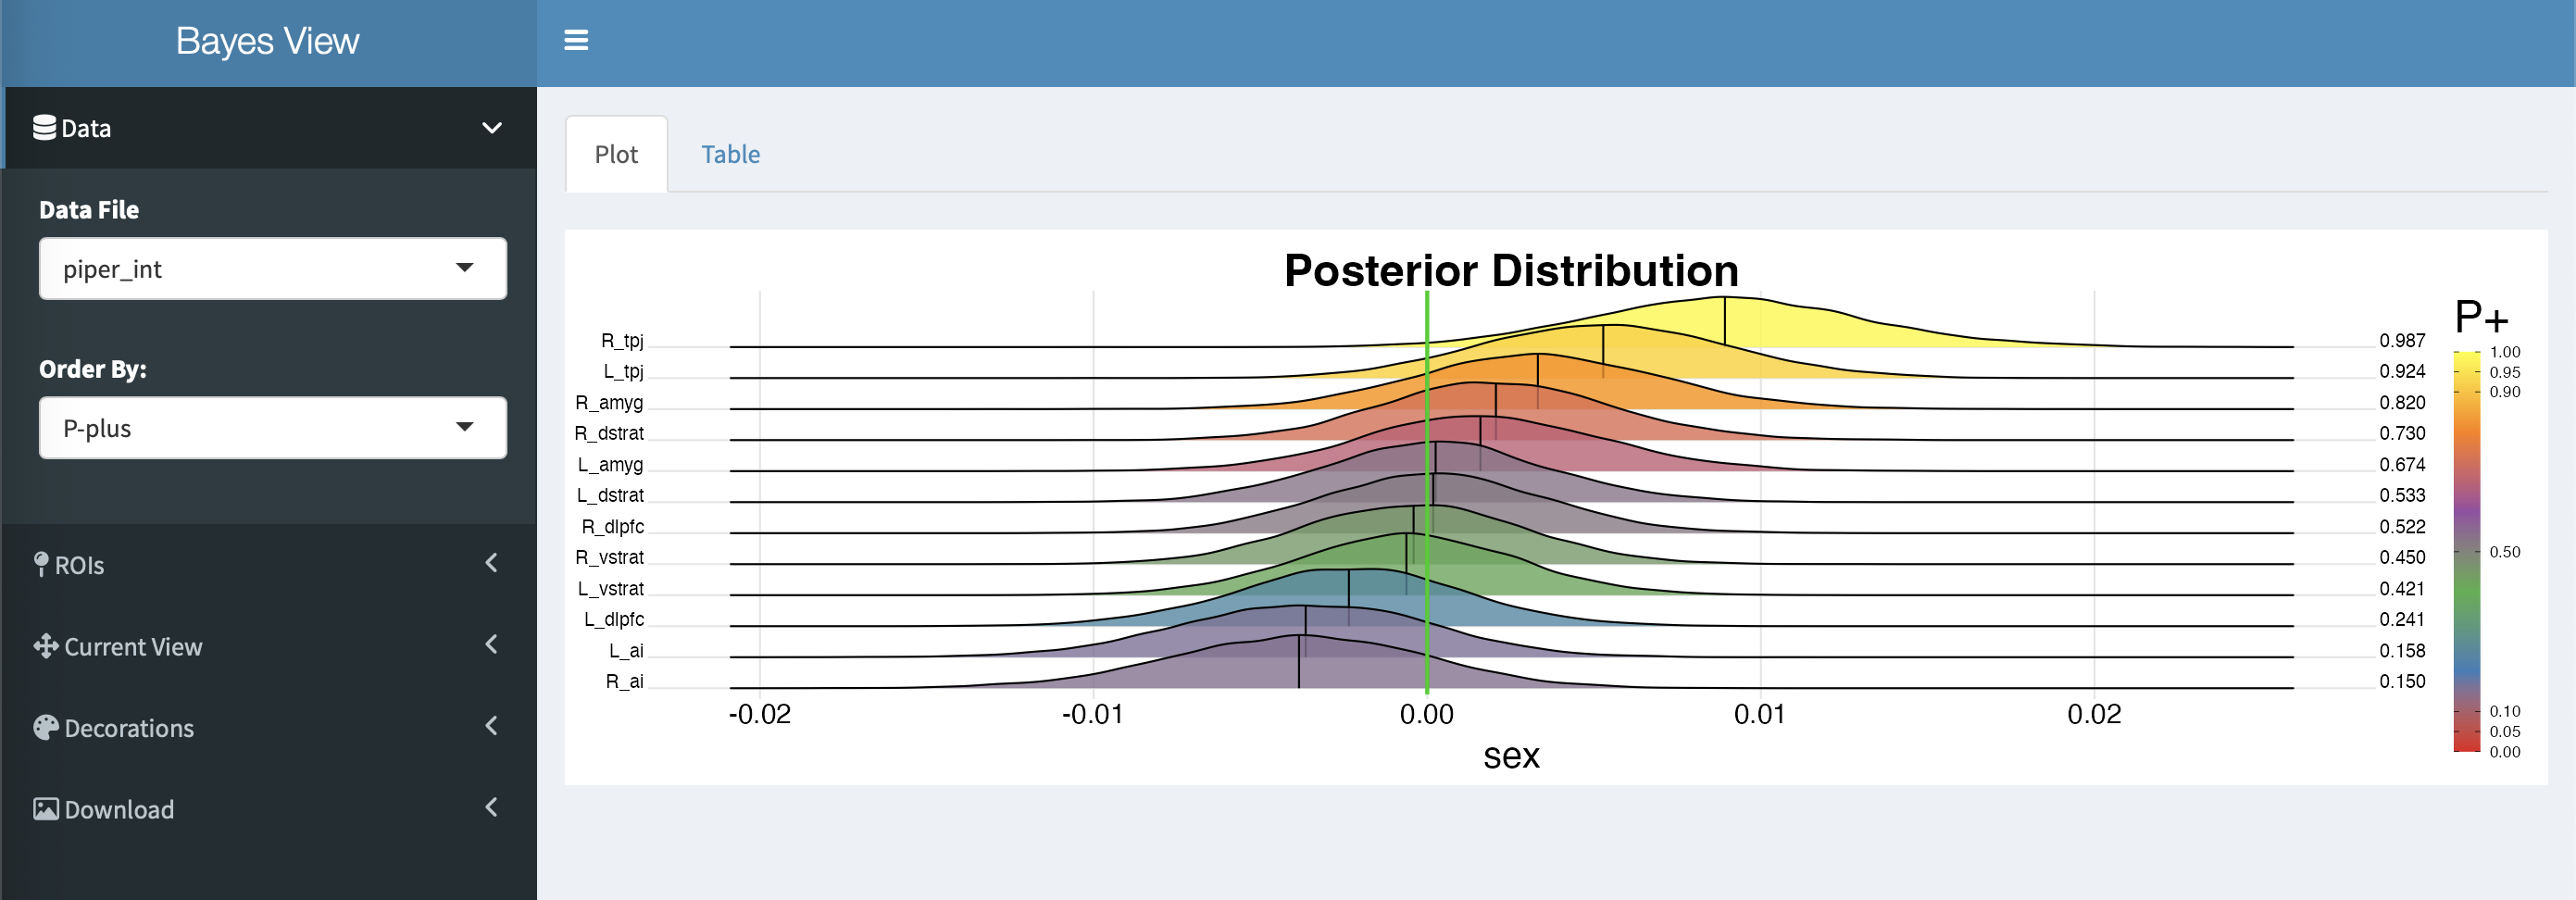
Question 2. In running bayes_view to visualize ridge plots, the GUI only shows one EOI (sex) with no ability to toggle to other EOI views across multiple browsers. I initially thought that -PDP 12 1 was the culprit, but the issue persists even when re-running RBA with -PDP 12 4. I've clicked around and didn't find any other options to toggle. Any ideas on how to fix, or if I'll need to manually create these ridge plots in R?
I'm happy to provide any other code, output, etc. that might be helpful. I look forward to your responses, TIA!