Hi, I would like to ask about the colormap in SUMA.
When applying thresholding to some map with |T| turned ON (so that both positive and negative values are displayed) using SUMA GUI, does the center value of the colormap shift according to the threshold, or does SUMA simply hide values below the threshold while keeping the center value at 0?
I'd appreciate it if you could let me know.
Thank you in advance.
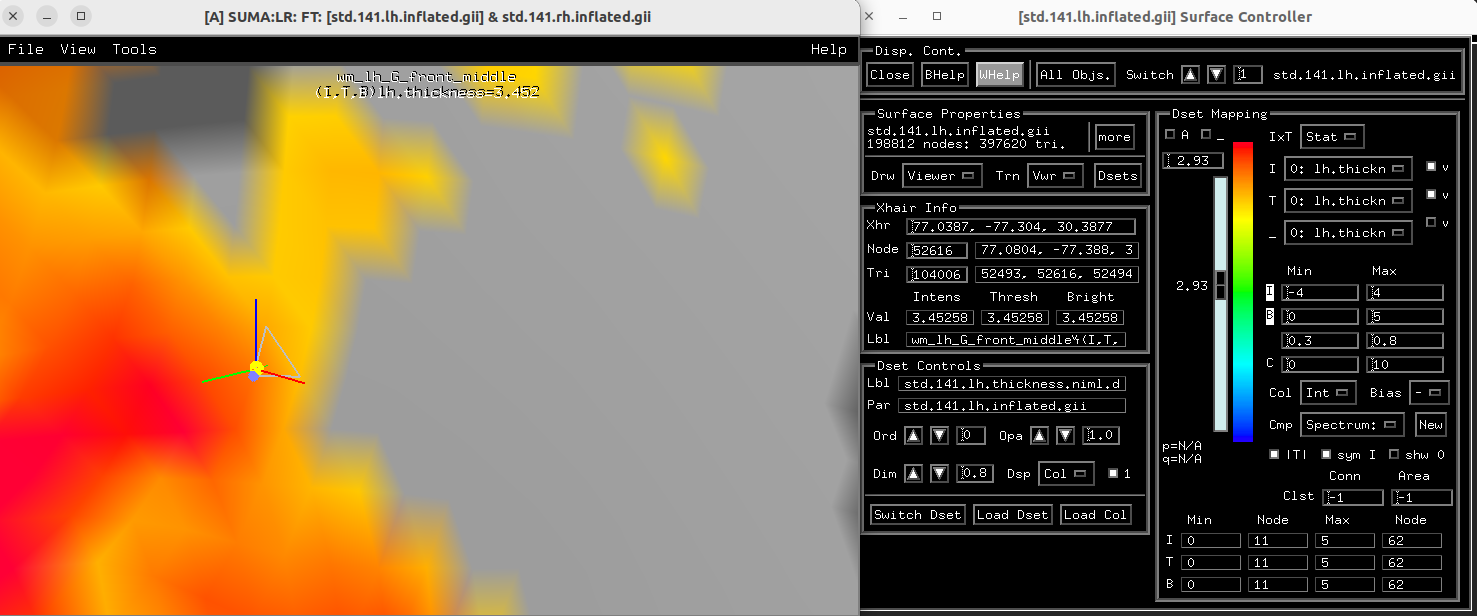
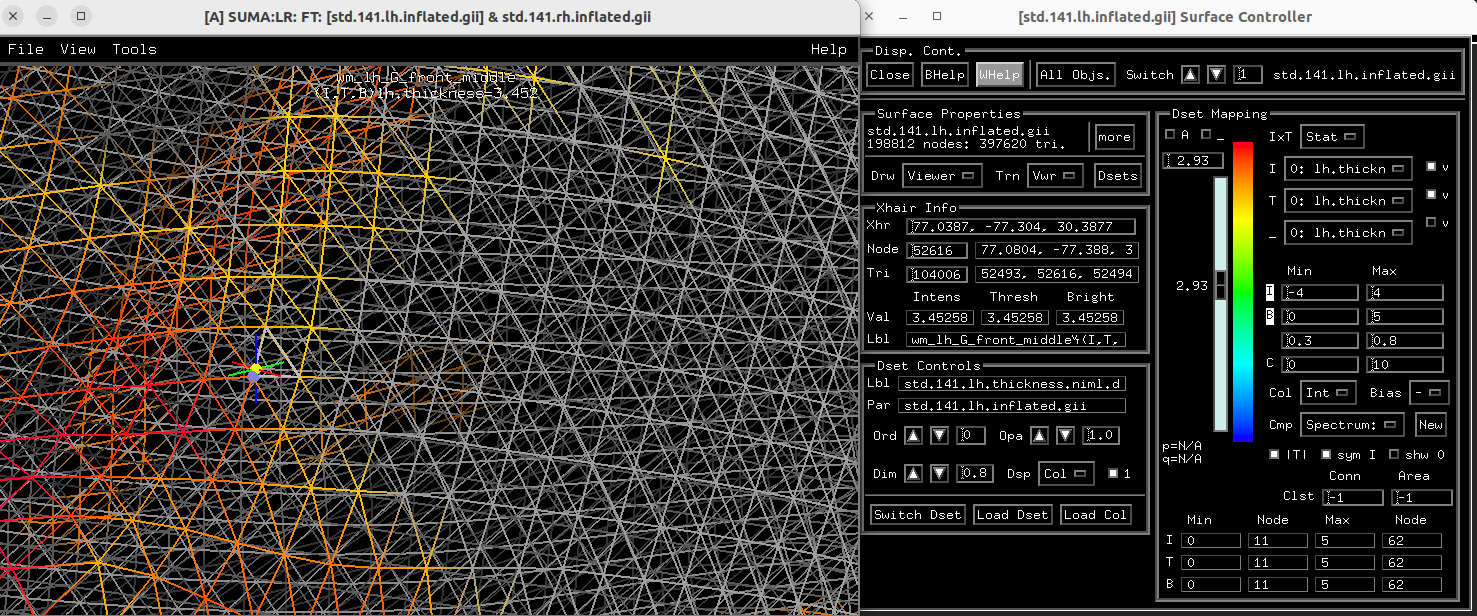
The values in the surface mesh are stored at the nodes in the mesh. Those are the values that get thresholded, too. The edges between the nodes get interpolated color, which is always a little tricky between a thresholded node and an unthresholded one---basically, the color fades to background gray. Then the colors of the triangles that make the surface of the mesh are also interpolated---in this case, between 3 values. So, 0, 1 or 2 nodes/corners of a triangle could be thresholded, and some overlay color will still be displayed there in some way.
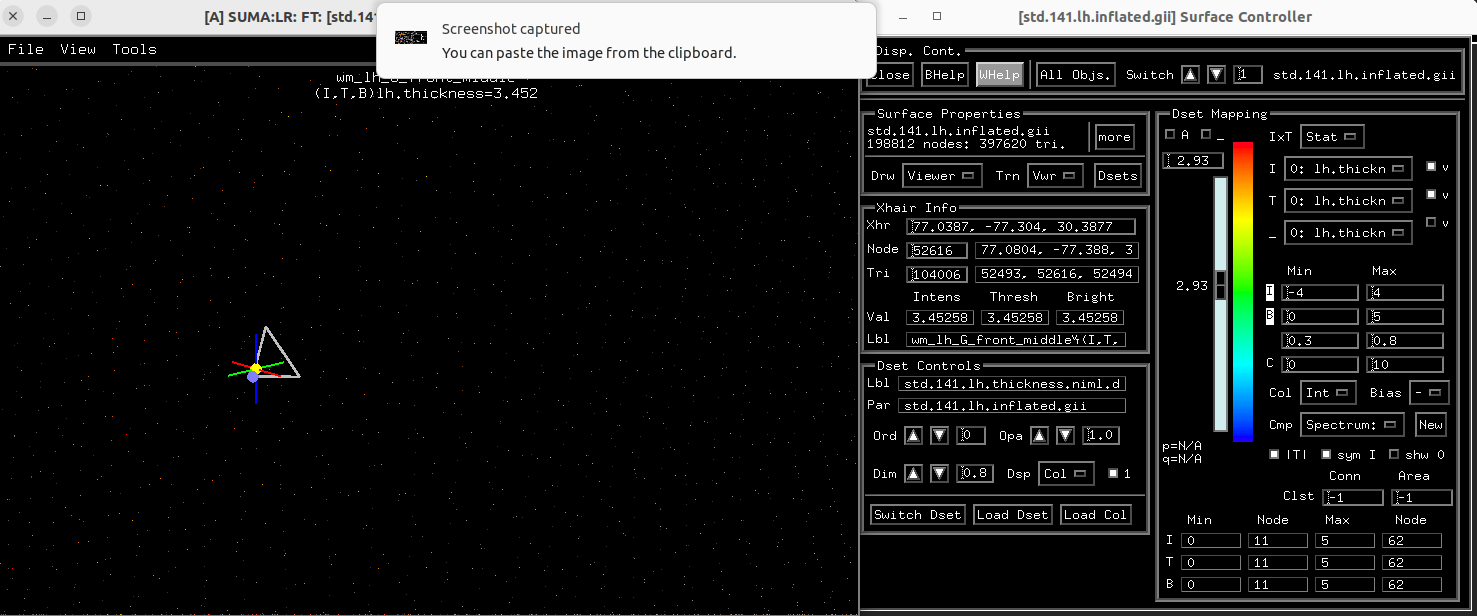
Here is a series of images of a thresholded mesh dataset, showing the triangles, then removing those to show the edges, then removing those to show just the nodes; see how the colors change:
In case you might be asking about the color bar, it's important to realize the threshold slider and the color bar are two separate things. With the |T| toggle on, the threshold slider ranges from 0 to the maximum value in the Threshold sub-brick/column. The applied threshold is used as a mask to show values at nodes at or above the absolute value of the selected threshold. With |T| off, threshold ranges from the most negative value to the most positive value, and the threshold keeps node values at or above the value of the threshold.
That's different than how the nodes are colored. Nodes get colors from how the intensity sub-brick value at the node maps to a color map. That's equivalent to the afni GUI interface for looking at 2D slices. You can control the min and max of the range of intensities mapped in the intensity row of the controller, with or with symmetry enforced through a separate toggle. "Shw 0" toggled on shows zero-values with colors from the color maps as long as they are not thresholded. The default is to hide values at zero, the same as in the afni GUI.
The blending effects that Paul mentioned add some additional details to this, so edges may be a bit fuzzy. Alpha thresholding adds even more nuance to this.
The
National Institute of Mental Health (NIMH) is part of the National Institutes of
Health (NIH), a component of the U.S. Department of Health and Human
Services.