AFNI version info (afni -ver): linux_ubuntu_16_64: Jul 30 2025 (Version AFNI_25.2.06 'Gordian I')
Hello AFNI/SUMA experts,
I would like to quantify how rapidly the T1 weighted image intensity changes near the border between gray matter and white matter, a measure previously reported to reflect myelination or disruptions in neuronal migration. My plan is to sample the T1w image along segments perpendicular to the gray/white boundary, then fit a sigmoid curve to those profiles to quantify transition sharpness. This question is specifically about projecting the T1w image to the surface and sampling along those segments.
My goal is to 1) define a region centered on the gray/white boundary, extending 25% of the cortical thickness toward the pial surface and 25% into the white matter (i.e., +/- 25% of thickness around the gray/white boundary) and 2) divide that region into 8 evenly spaced intervals (i.e., 9 sampling points including the end points) and output the sampled intensity values along each segment.
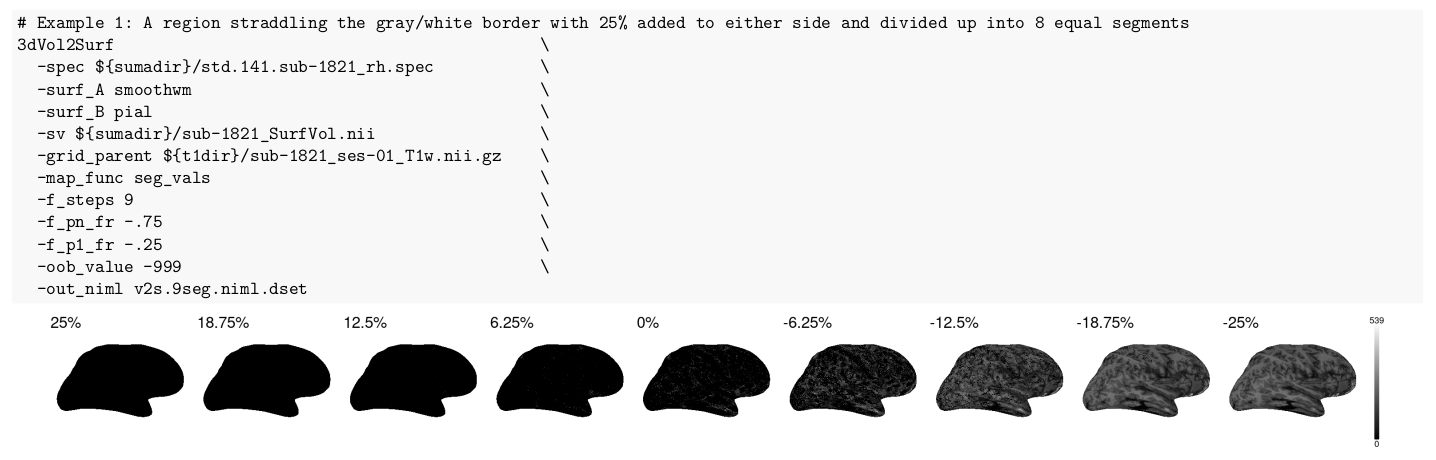
I’ve tried using 3dVol2Surf with arguments -map_func seg_vals and the -f_pX_fr flags to position and divide the segments. Example command and resulting plots:
I set -f_steps 9 to get 9 samples across the region (8 intervals). And I set -f_pn_fr -.75 and -f_p1_fr -.25 so that I have +/- 25% thickness around the gray/white boundary. However, many of the sample points (nodes) return zero intensity values (pure black) even though the T1w image’s sampling positions should fall in gray or white matter (not background with black point of zero).
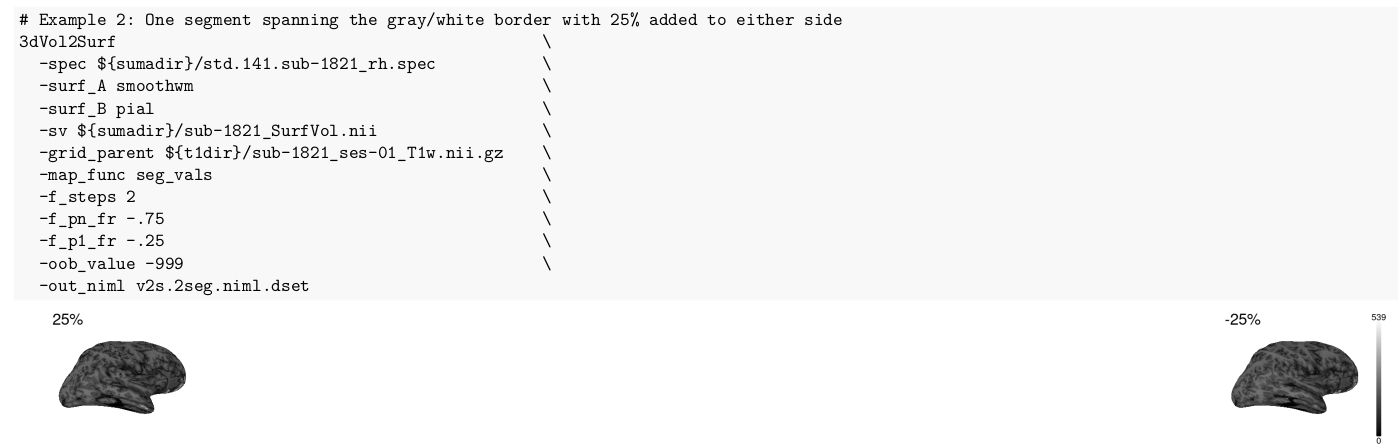
As an experiment, I ran the command with -f_steps 2 (i.e., a single segment between the two end points)
I expected the two outputs here (+25% and -25% of thickness around the gray/white boundary) to match the first and last samples in the 9-step output earlier (example 1 above). But they do not – the 2 step run shows far fewer zeros than the 9 step run. Why would this be? Do you have some guidance on how to reliably extract these intensity profiles for later curve fitting?
The p1 .. pn points will go from surf_A to surf_B, the smoothwm to the pial in your example. That is a segment that fractionally maps from to 0 to 1. So to add 25% on each side, consider:
-f_p1_fr -0.25 \
-f_pn_fr  0.25 \
So your current value for p1 seems good. But pn of -0.75 would be very close the the smoothwm, using +/- .25 around smoothwm.
Still, I would not expect many zeros near your smoothwm surface locations, so that is a bit concerning.
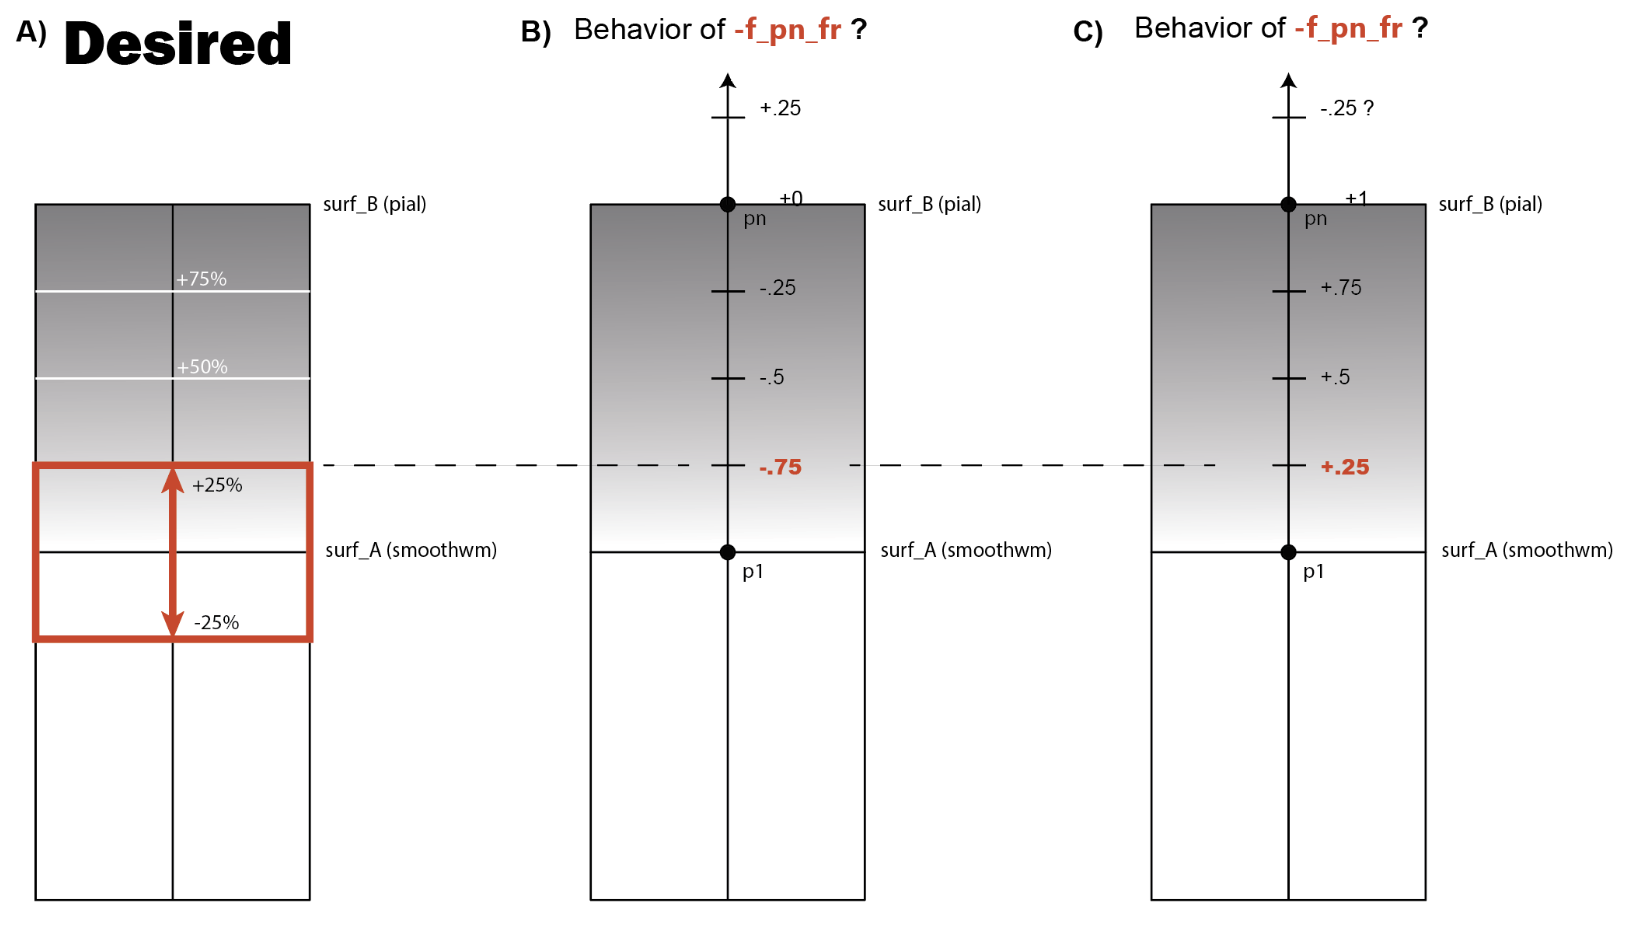
Thanks for the response, Rick. Now I'm rather unclear about the scale used for moving point pn. I made the following illustration to help. What I want to achieve here is the red region in panel A. I was under the impression that positive values of the fraction for -f_pn_fr would move point pn further away from the smoothwm and negative values of the fraction would move it closer (see panel B). Are you saying the scale is more like the way I've drawn it in panel C?
Sorry, my mistake. I was somewhat assuming that you wanted 25% outside the pial, not just +/-25% around smoothwm, though you did describe it. So your initial options were correct.
Ignoring the zeros for a moment, what is the resolution of the T1? Assuming a common smoothwm->pial segment length of 4 mm, your segments will be around 2 mm, and then get broken into 8, 0.25 mm intervals. Is the T1 resolution that high?
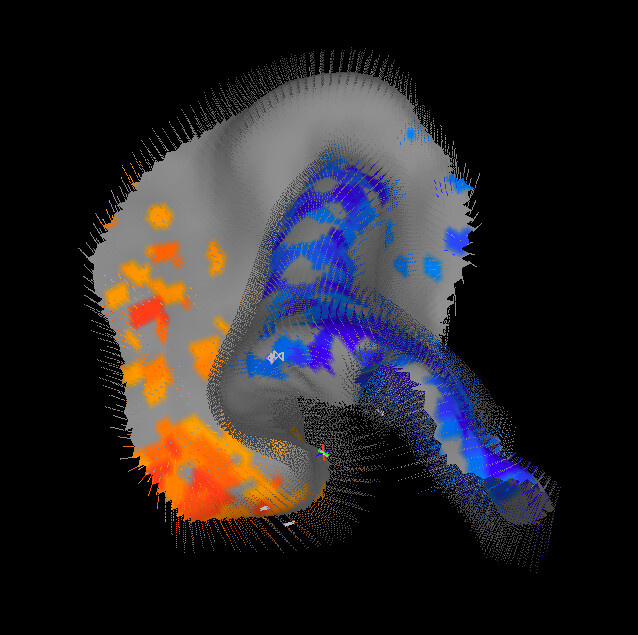
Consider the SURFLAYERS demos that you can install with @Install_SURFLAYERS_DEMO1 contributed by Sam Torrisi. This makes use of the SurfLayers program to generate intermediate surfaces between a pair of surfaces like the smoothwm and pial surfaces generated by FreeSurfer. Here is an image from the calcarine sulcus from the demo. Using the intermediate layer surfaces, you can then do the +/- mm around each surface more easily. Another option that can work together with that is the LayNii package for layer analysis.
No worries, Rick. I'm relieved I understood things correctly. For the T1w, the nominal resolution is 1mm isotropic. Is that enough resolution to measure the intensity values of those tiny segments? Does 3dVol2Surf involve some sort of interpolation in this case?
The following study (which I'm trying to replicate) made such measurements (approx. 0.25mm intervals) from T1w scans of similar resolution (1mm isotropic):
Olafson, E., Bedford, S. A., Devenyi, G. A., Patel, R., Tullo, S., Park, M. T. M., ... & Chakravarty, M. M. (2021). Examining the boundary sharpness coefficient as an index of cortical microstructure in autism spectrum disorder. Cerebral Cortex, 31(7), 3338-3352.
Daniel - Thanks! I'll look into the SurfLayers package.
Getting back to the zeros now, this is strongly controlled by the -f_index option, which is not currently included, which means it is using the default of 'voxel'. And this sort of gets to the resolution of the data.
Assuming the resolution is 1 mm^3, and assuming a common segment spans about 2 mm, then such a segment might intersect 3 voxels, give or take. Using -f_index voxel would result in getting 3 values output (and so the rest will be zero, for completeness, since you asked for 9 values). Using -f_index nodes means there will always be 9 values output, since every segment point should be within the T1w volume (assuming it isn't masked).
While the 9 values using nodes seems better, and is probably what you want, keep in mind that the values will be exactly the same. If there were 3 voxels hit in the voxels case, and therefore 3 non-zero values in the result, the 9 value output will be exactly the same, but where each voxel value is repeated as many times as a segment point is within the voxel. Notably, there is no interpolation here.
For example there might be 1 value for the first voxel encountered, 5 values for the next one (i.e. most of the segment lies within that next voxel), and the remaining 3 values in the last one. If you do the 'g' graph plot of the result at this voxel, the -f_index voxel case would have 3 T1 values, then 6 zeros. The -f_index nodes case would show the 1 first voxel value, then a flat line of the 5 values at the next voxel, then a flat line of the 3 values of the last voxel. The only difference is showing how much of each segment is within each voxel.
This curve-shape analysis of the values might be assuming data resolution that is higher than what you have.
Thanks for the very clear explanation, Rick. I understand now! Changing to -f_index nodes gave me what I was expecting - a value for each node along the 9 segments representing the intensity of the voxel the current node is intersecting (as opposed to only the unique voxel values along the segment with the rest padded with zeros as returned by -f_index voxels, which is the default). This is exactly what I wanted, so thanks for solving my problem!
The
National Institute of Mental Health (NIMH) is part of the National Institutes of
Health (NIH), a component of the U.S. Department of Health and Human
Services.