Hi,
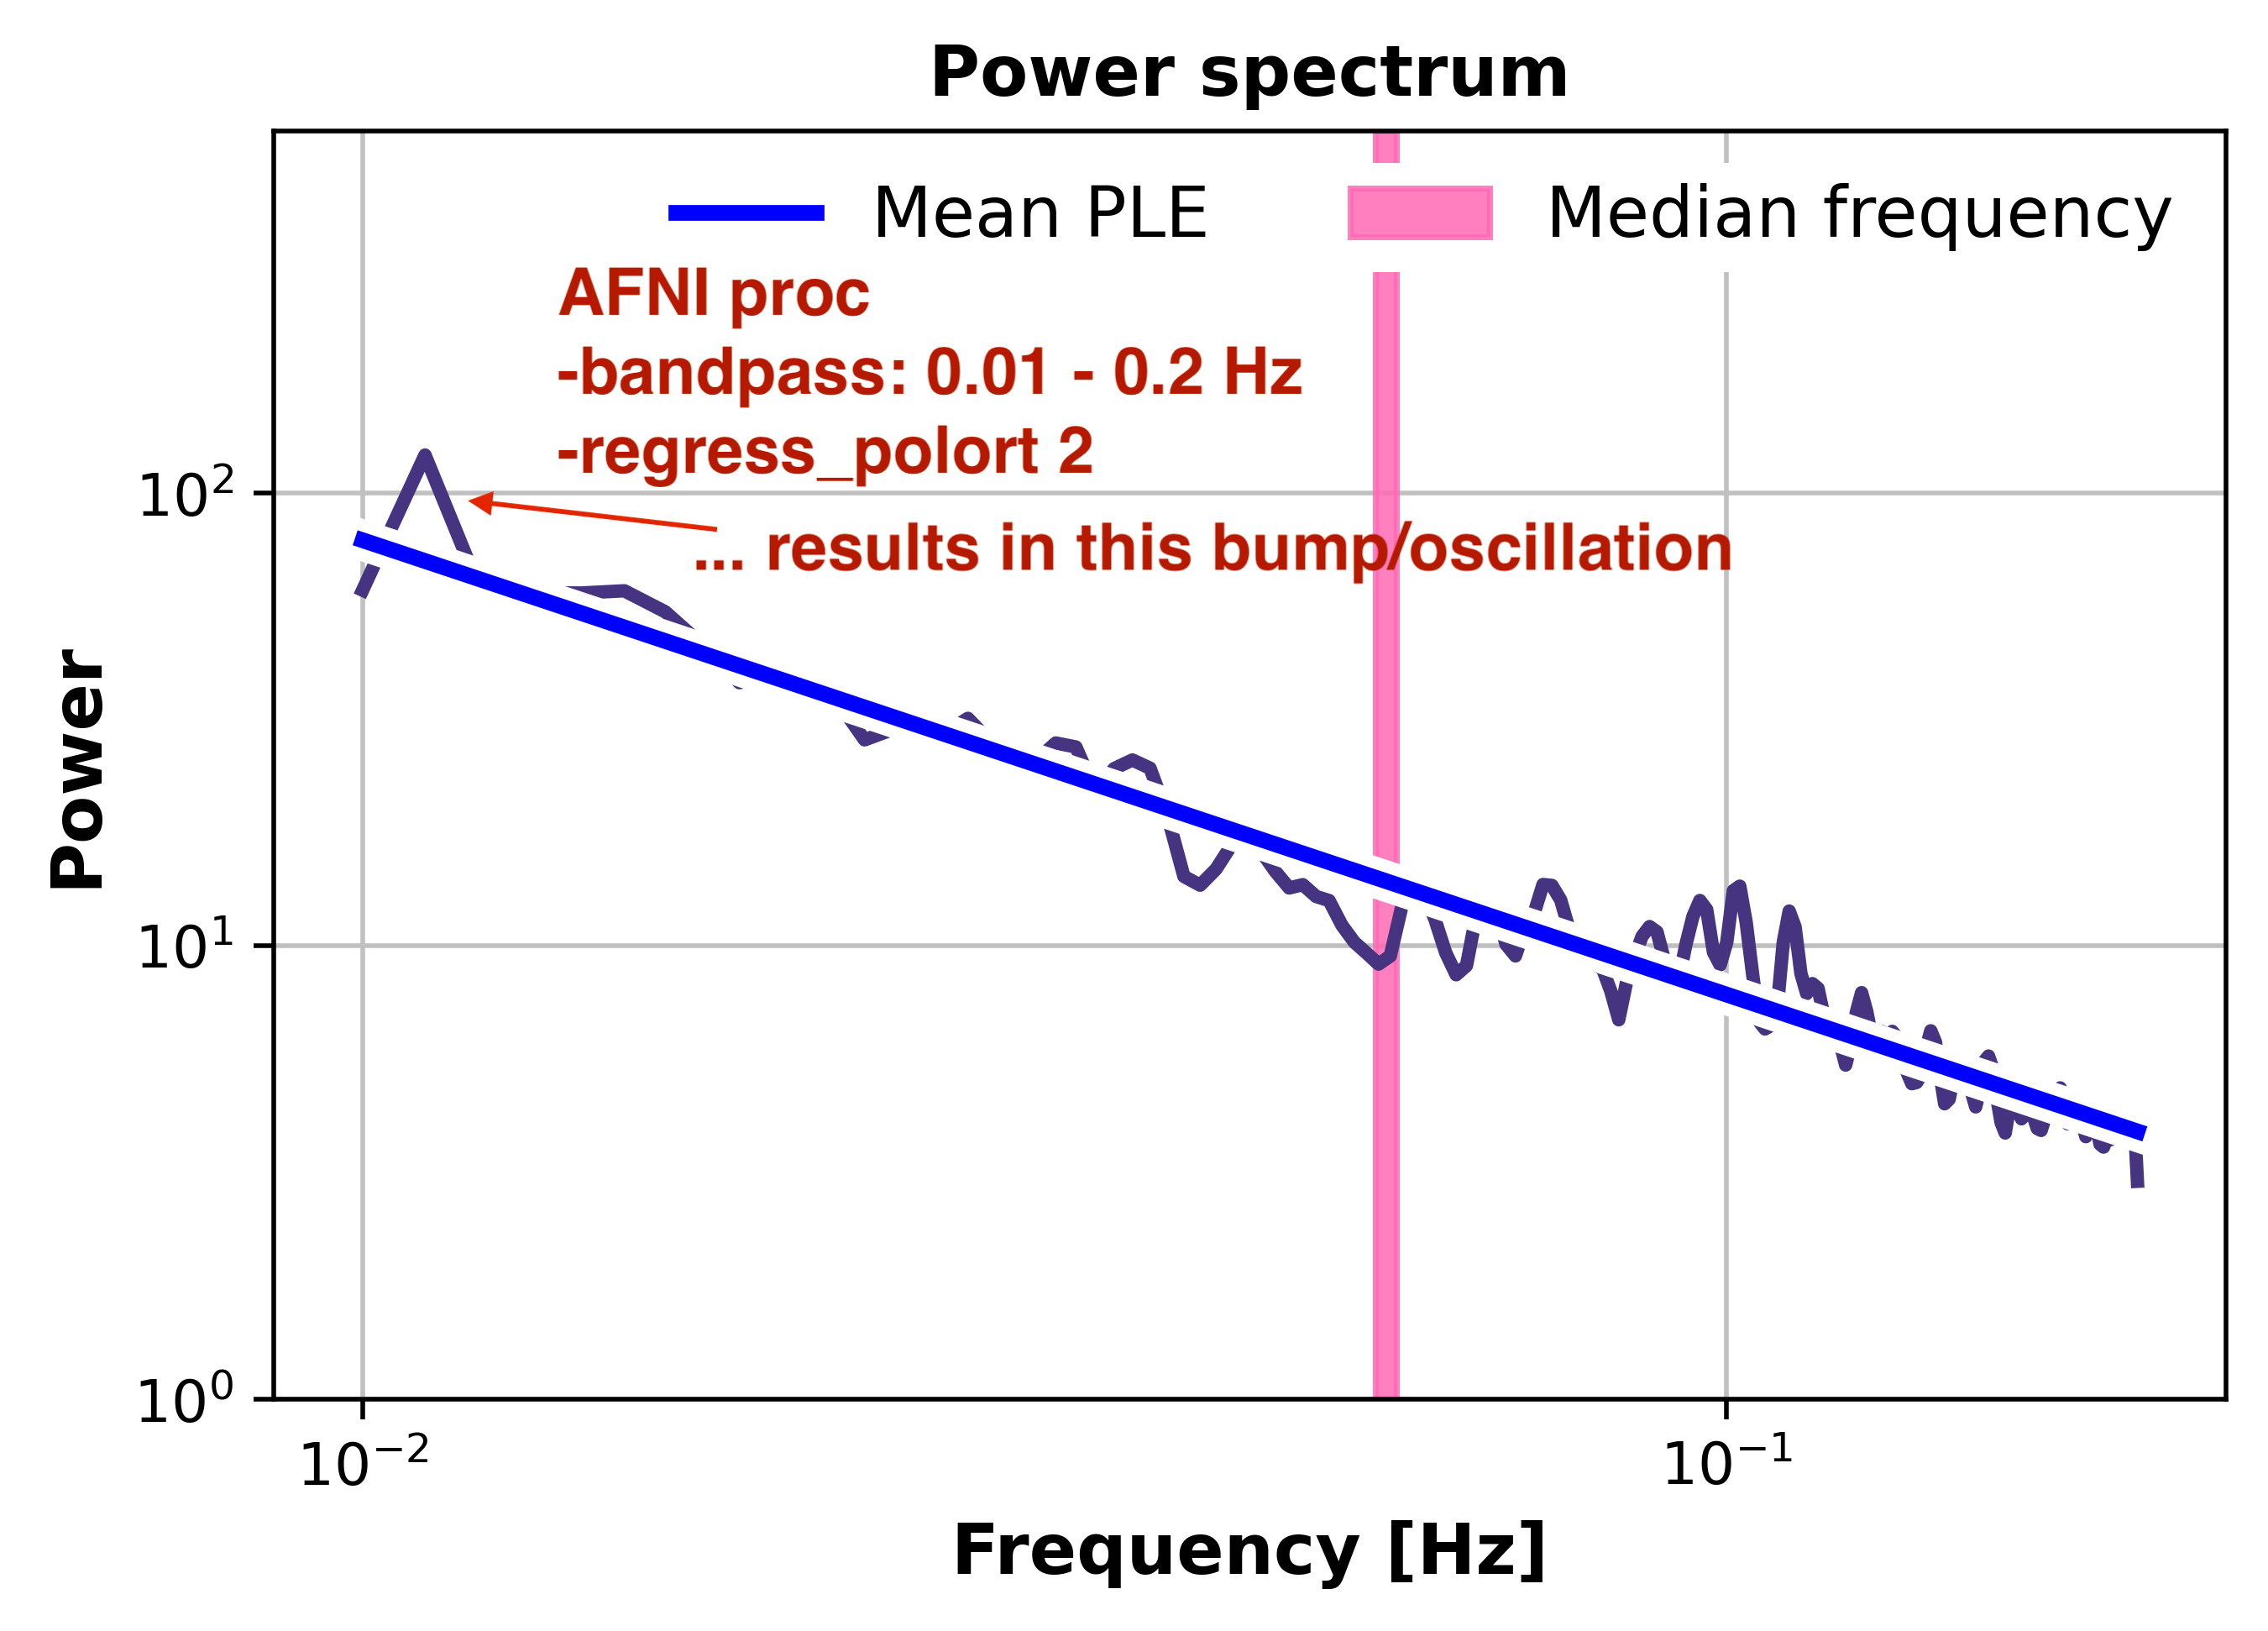
I am currently further preprocessing (using a minimalistic AFNI proc script shown below) the so-called minimally preprocessed 7T HCP resting-state and movie task dataset/runs. I preprocess both runs with a resting-state script.
The problem is that preprocessing introduces a systematic power increase around 0.011 Hz for almost all out of 30 subjects in the primary visual cortex V1, and also slightly in other regions, such as in the primary auditory cortex (A1).
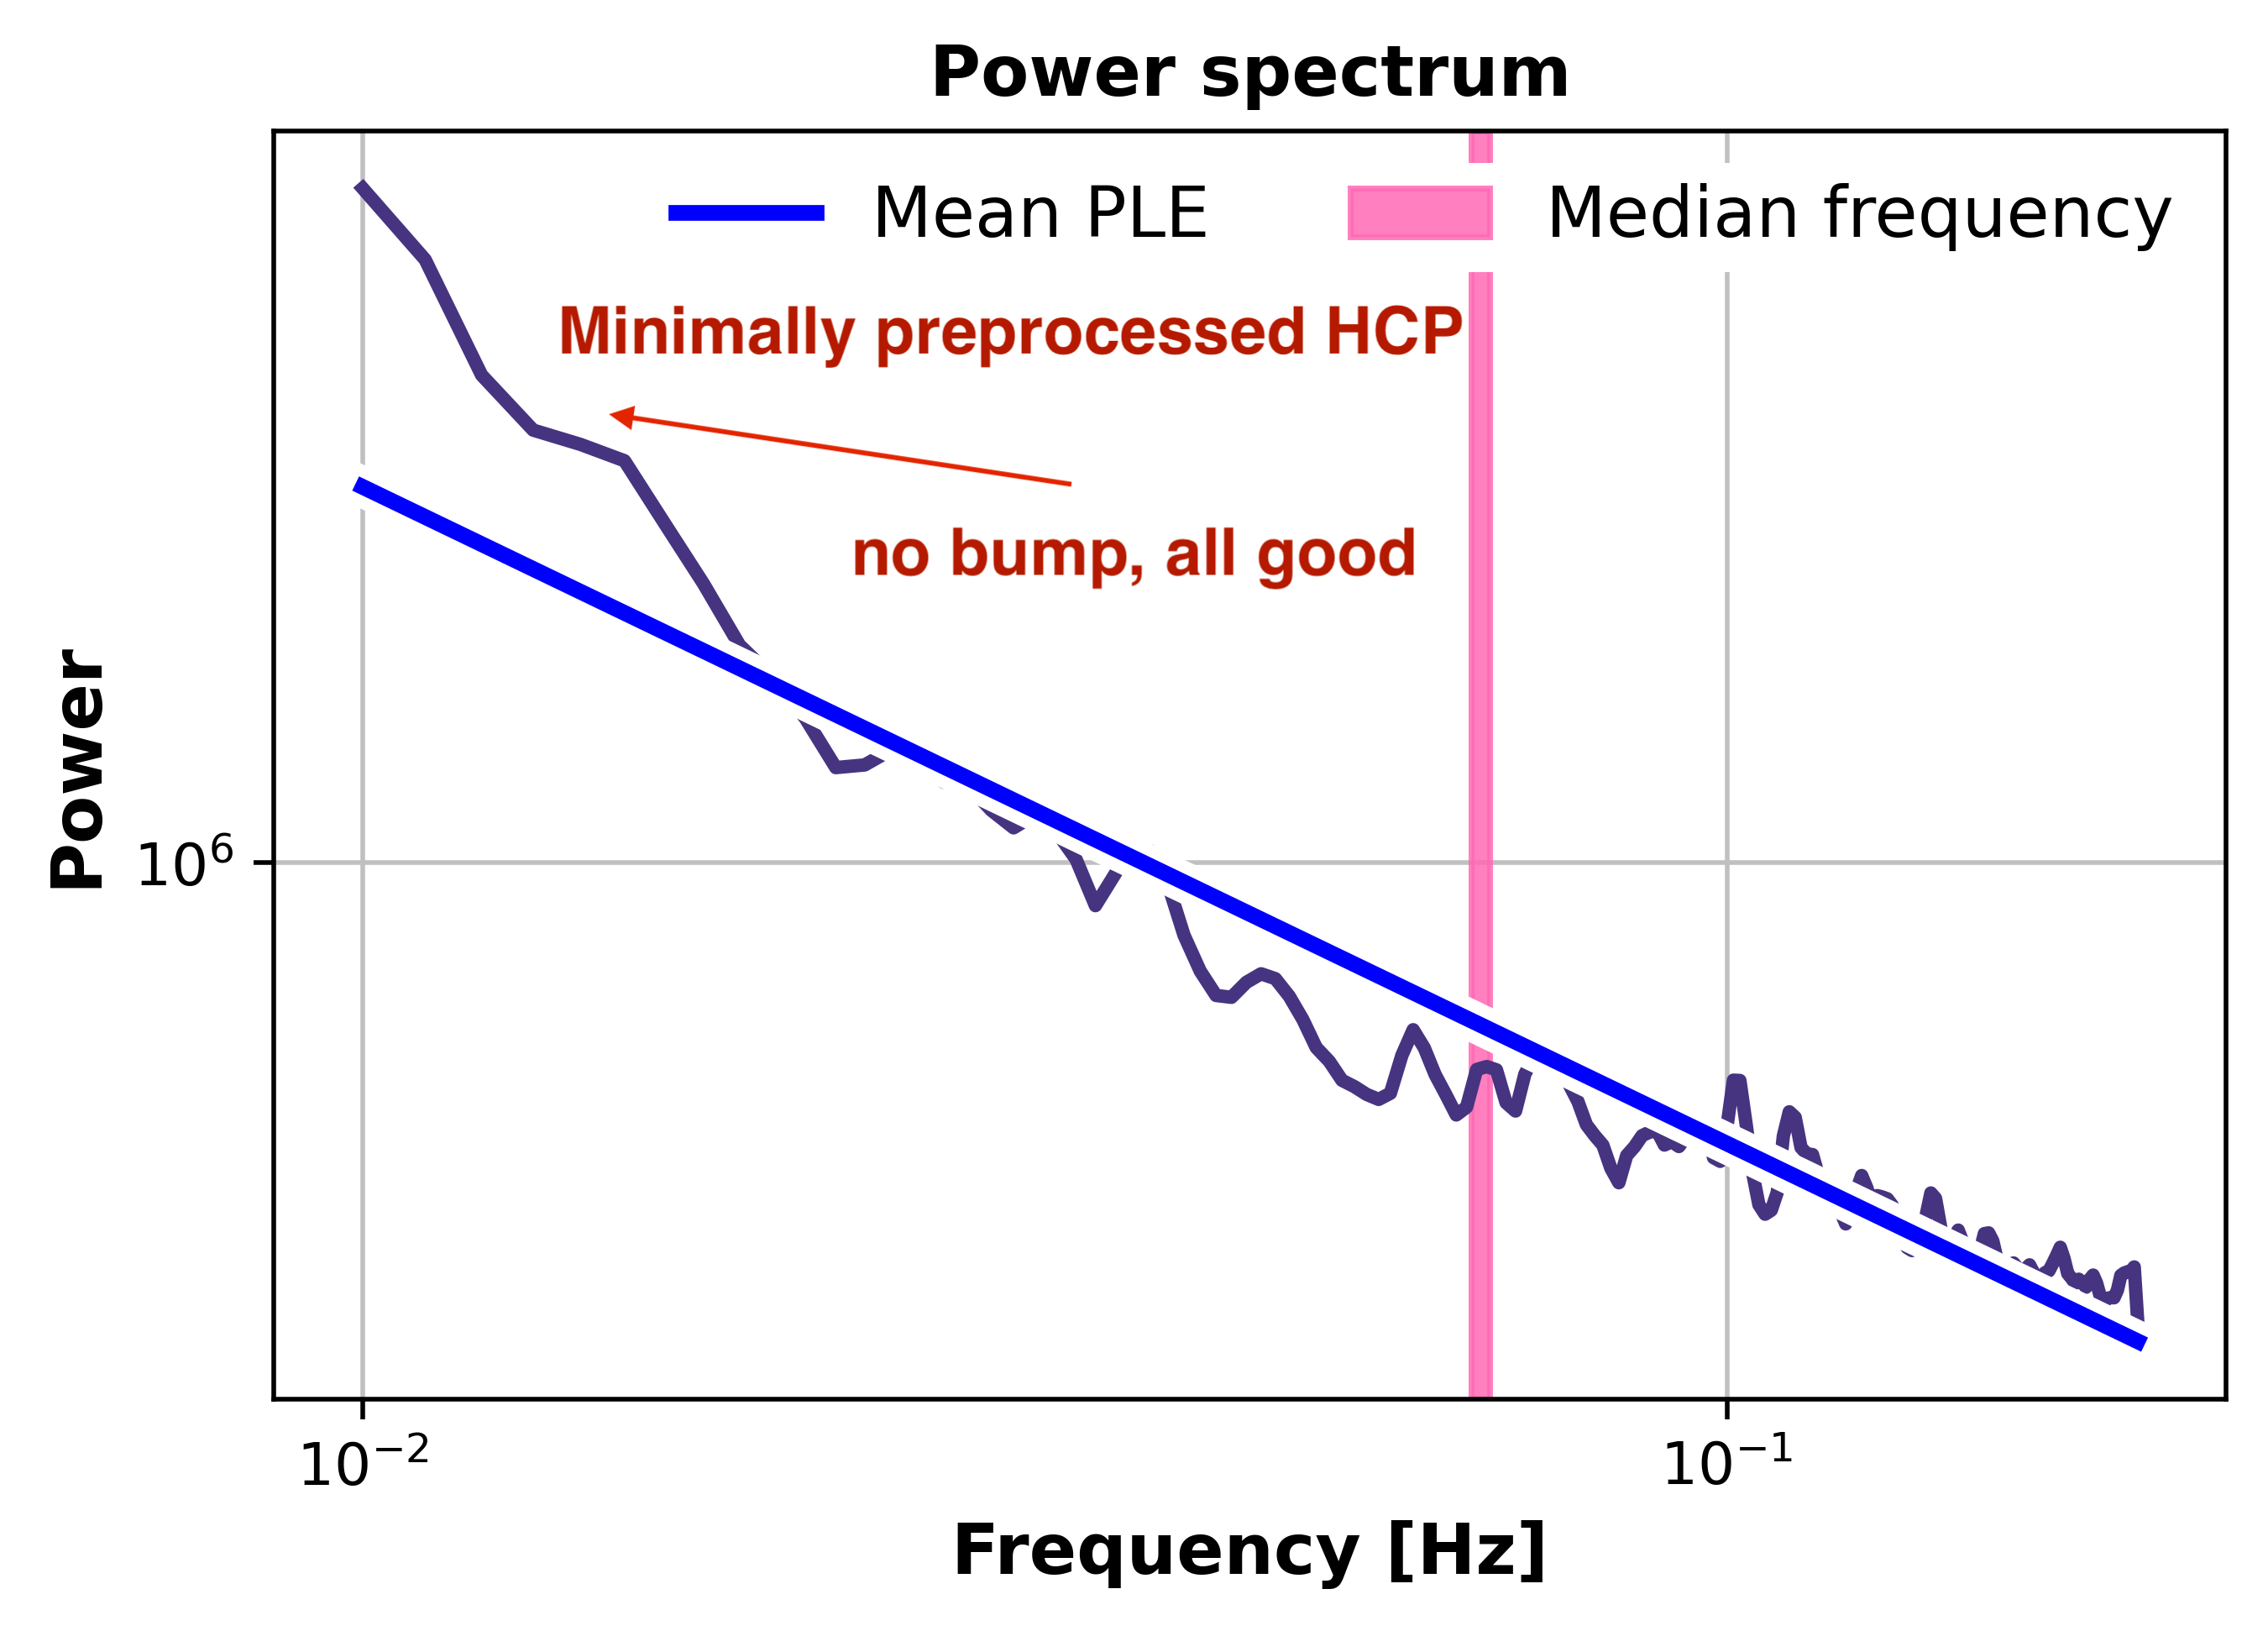
This bump is not prevalent when plotting the minimally preprocessed data without further processing it with AFNI proc. I attach many pictures of normal as well as log-log power spectra in this post that especially highlight this oscillation around 0.011 Hz. Furthermore but not shown here, I plotted the results of all preprocessing blocks (talking about the “pb xy …” results, such as tcat, blur, scaling) from AFNI proc to check at what preprocessing step the bump is introduced. It seems that the frequency bump is introduced only in the final .errts file.
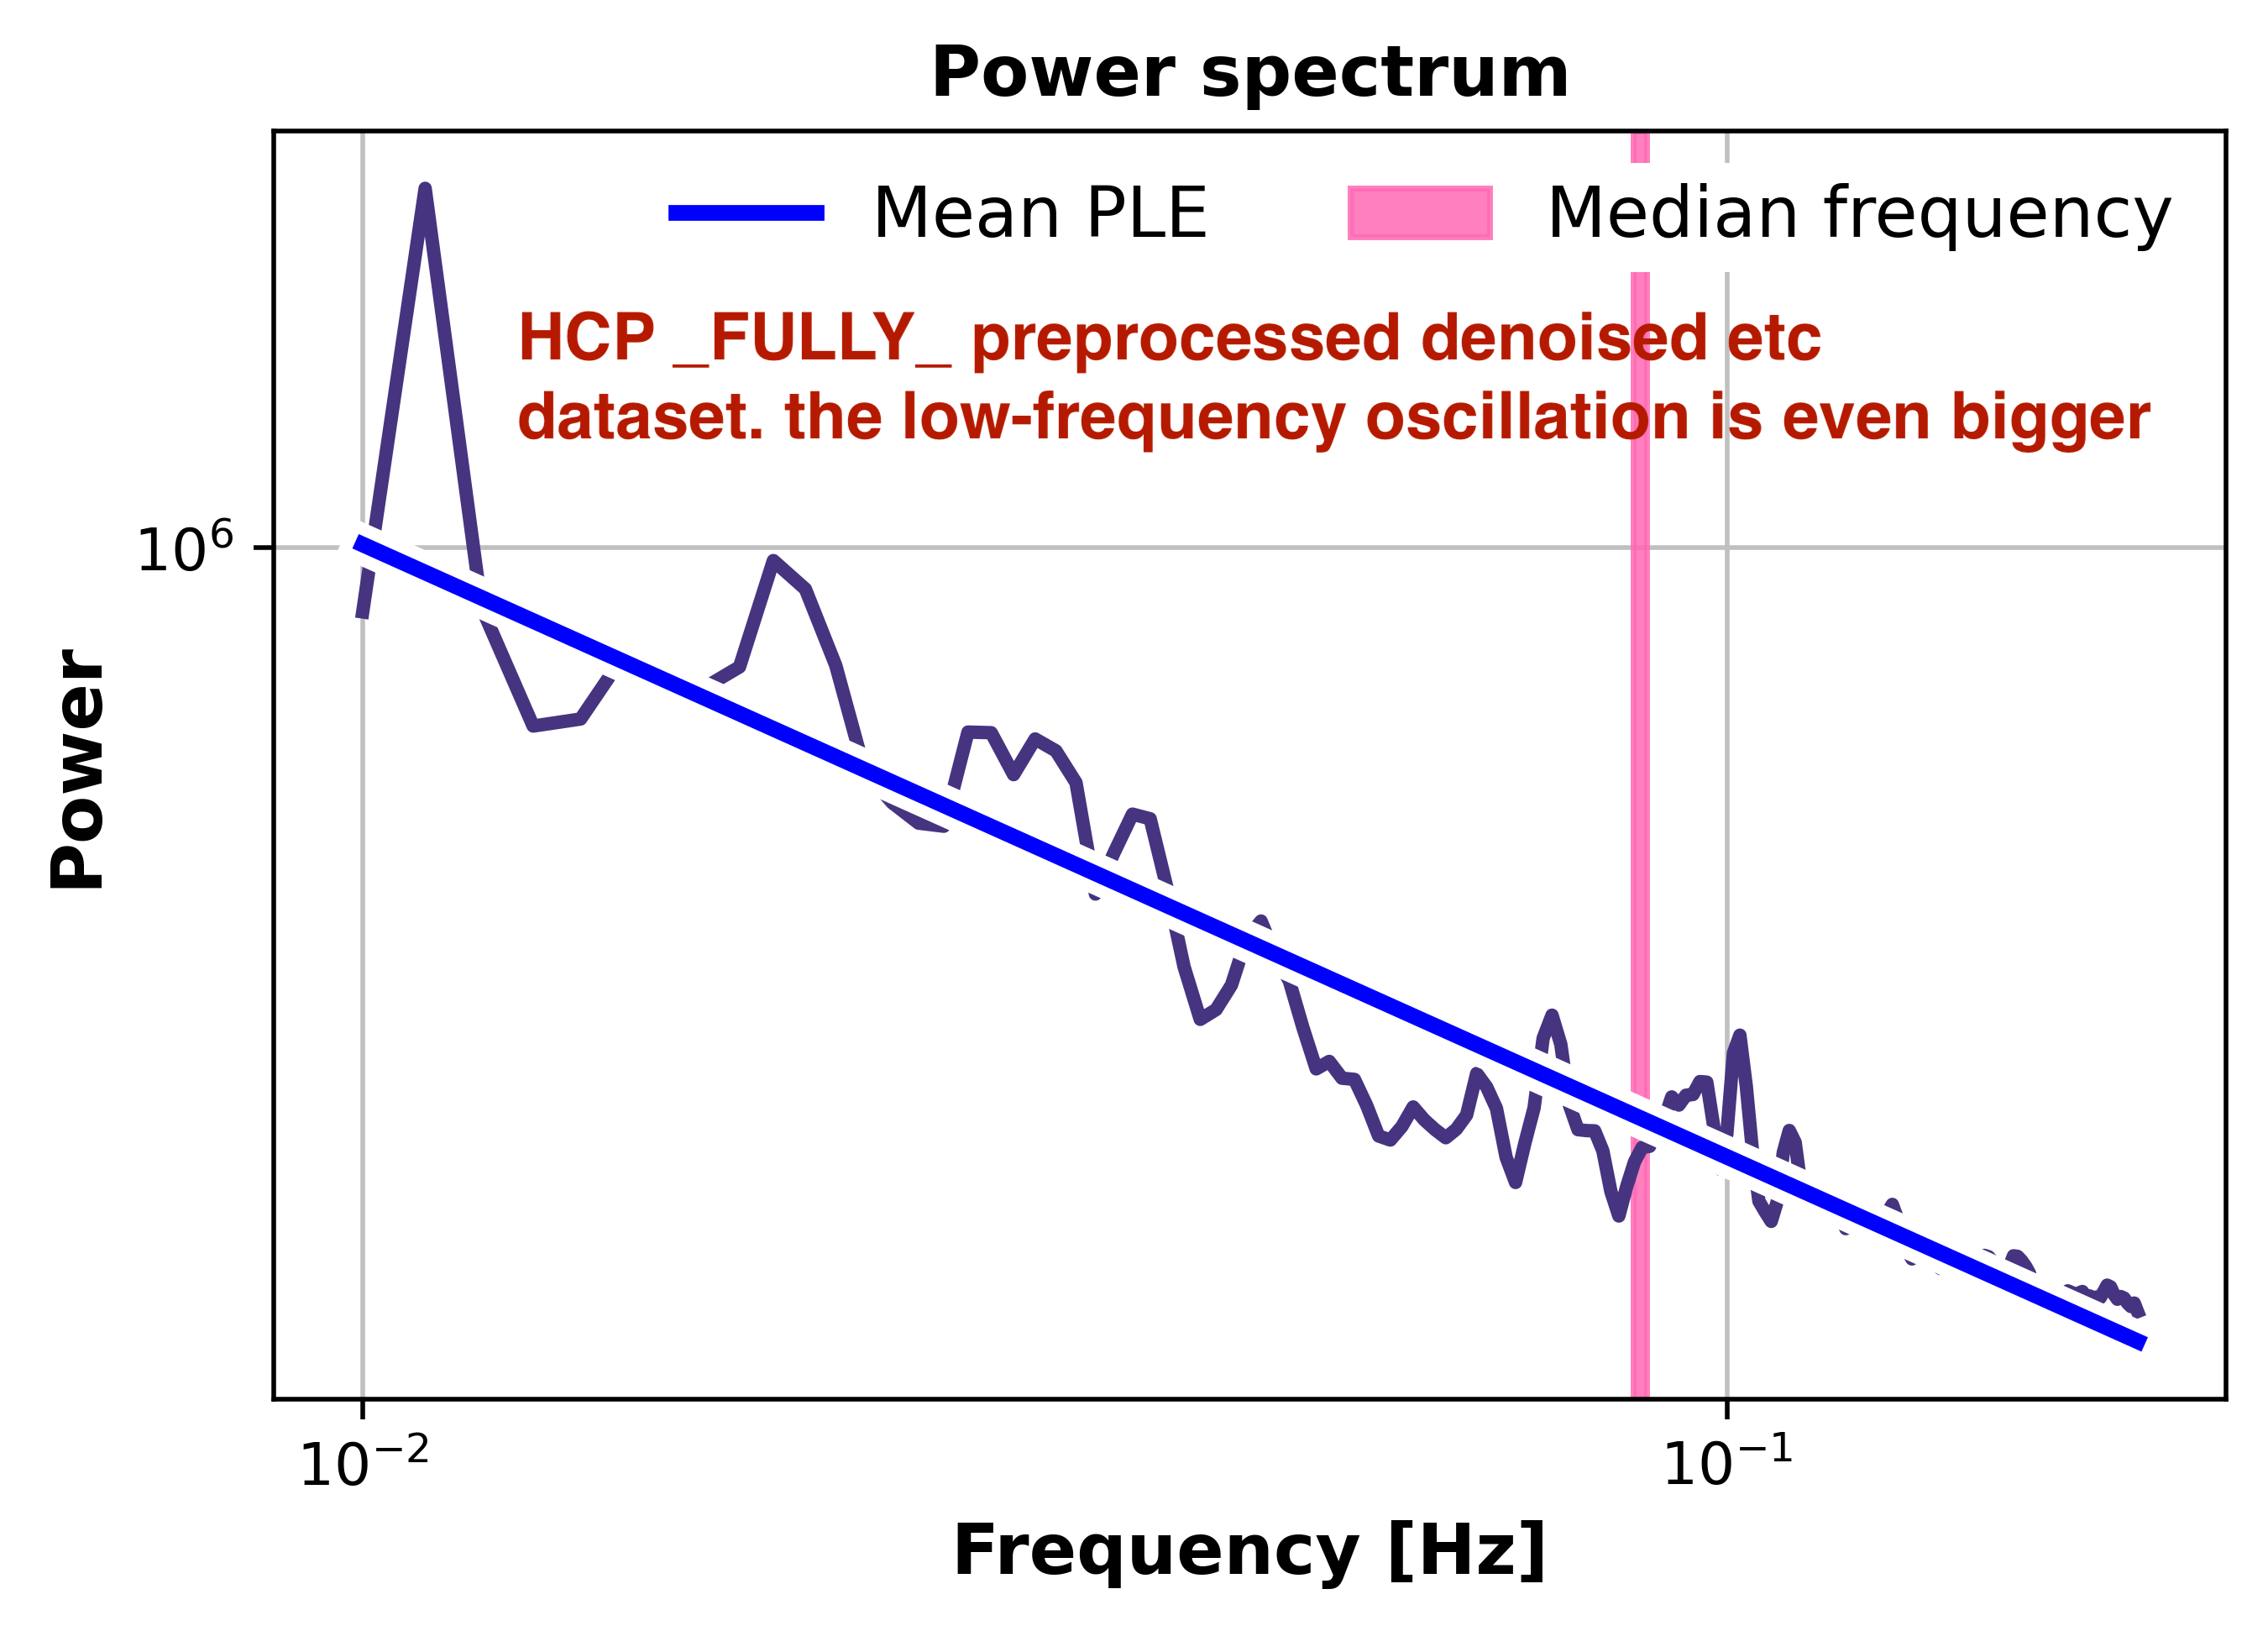
Interestingly, this frequency bump also shows up in the fully preprocessed + denoised HCP data, and even more so there (picture attached below). Hence, their preprocessing pipeline somehow introduces this bump as well. The bump or oscillation is not related to the movies shown, since it also occurs in the resting-state, although not that heavily. The onset/offset of the single movie clips shown also falls way below 0.01 Hz, hence it couldn’t show up as a major oscillation around 0.011 Hz.
I wonder if you guys could provide ideas regarding the followig questions:
- Why does especially AFNI proc (and the fully preprocessed HCP pipeline) introduce such a systematic oscillation around 0.011 Hz?
- Is there a way to avoid introducing this oscillation in AFNI proc? Since the minimally preprocessed HCP dataset does not contain this bump, maybe there is a possibility to further preprocess their data without AFNI proc introducing this bump. Are there suggested AFNI proc settings that I should change or use?
See my AFNI proc script here (shown for rest, but its the same for task)
afni_proc.py \
-subj_id ${subject}_Rest \
-out_dir $dir/Results \
-dsets \
	$dir_ts/Cut_rfMRI_REST1_7T_PA.nii.gz \
-blocks despike tshift blur mask scale regress \
-copy_anat $dir_sswarper/anatSS.$subject.nii \
-anat_has_skull no \
-regress_anaticor_fast \
-regress_bandpass 0.01 0.2 \
-regress_polort 2 \
-blur_size 3.2 \
-html_review_style pythonic \
-execute
I also tried preprocessing without bandpassing and another time with polort = 0. However, these two preprocessing attempts also did not change a thing, the bump still shows up.
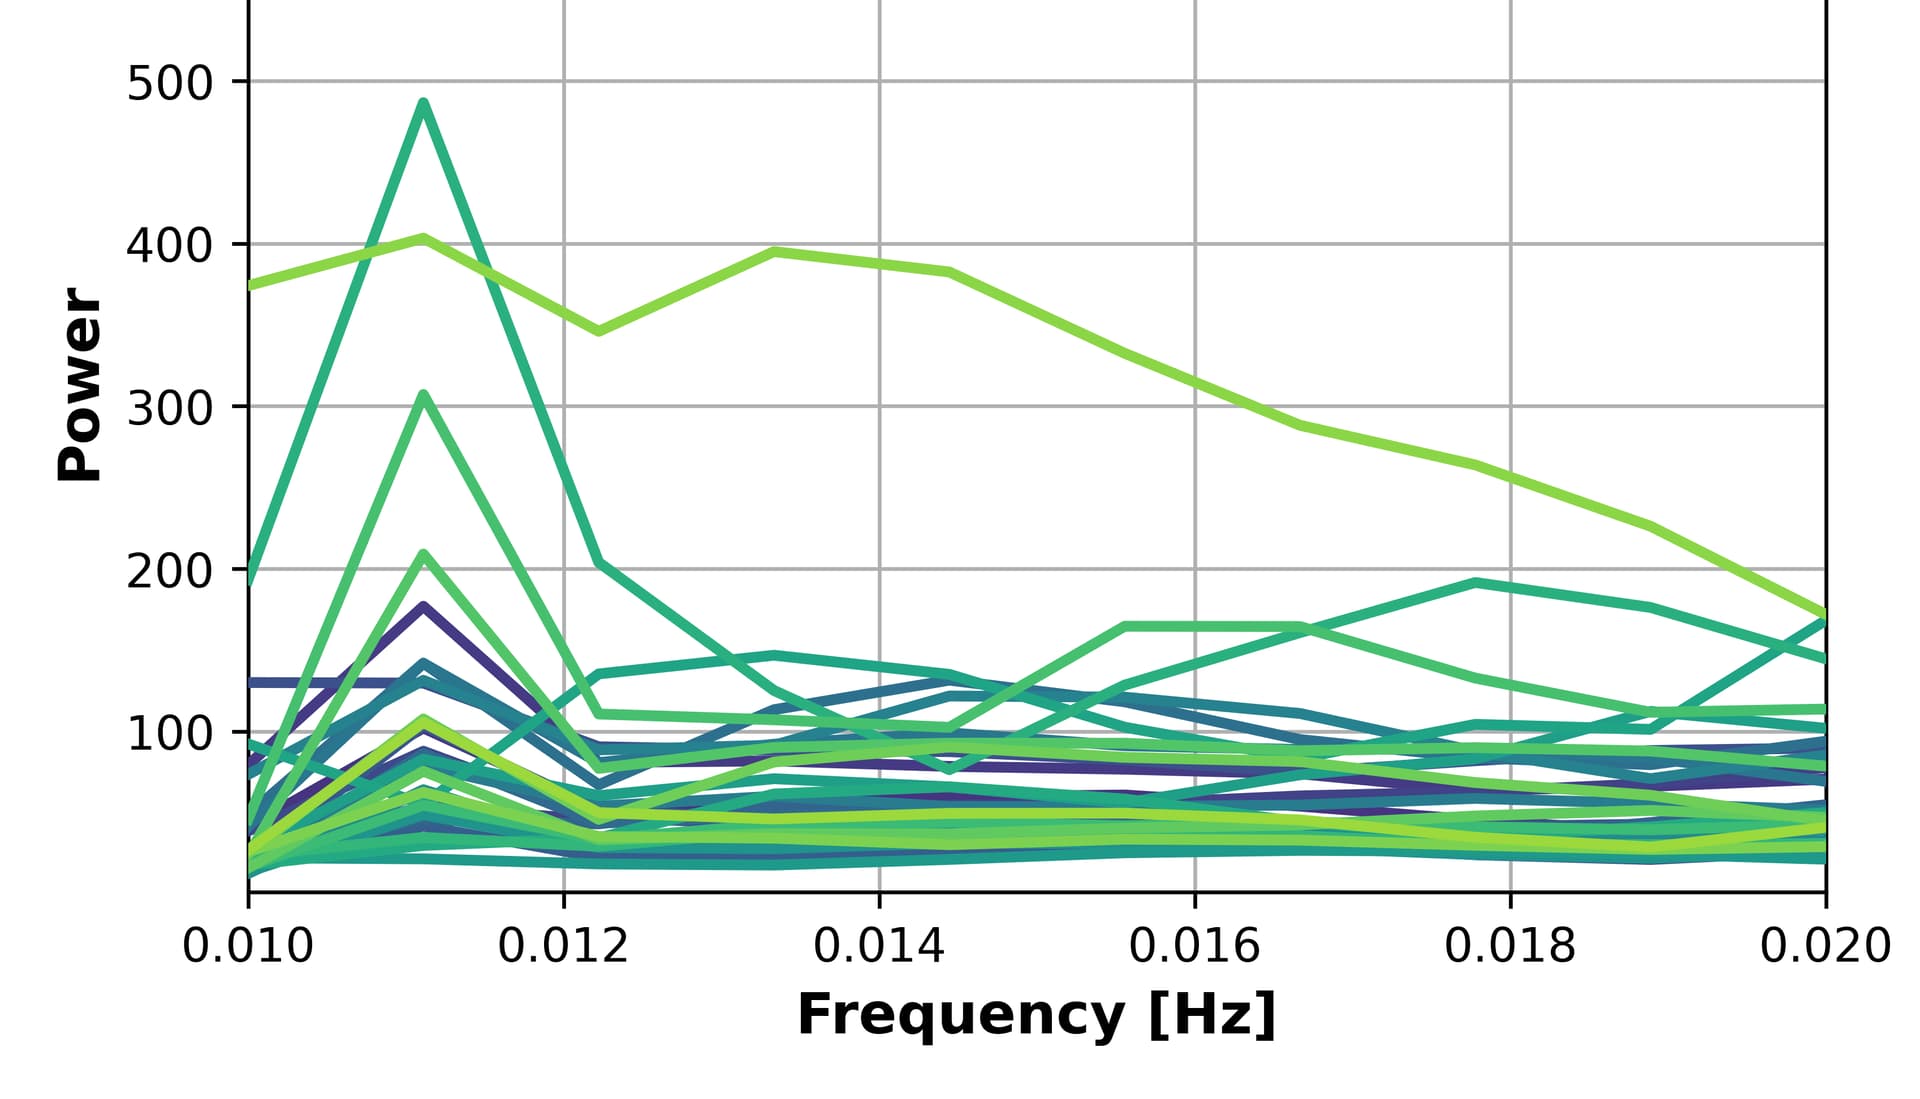
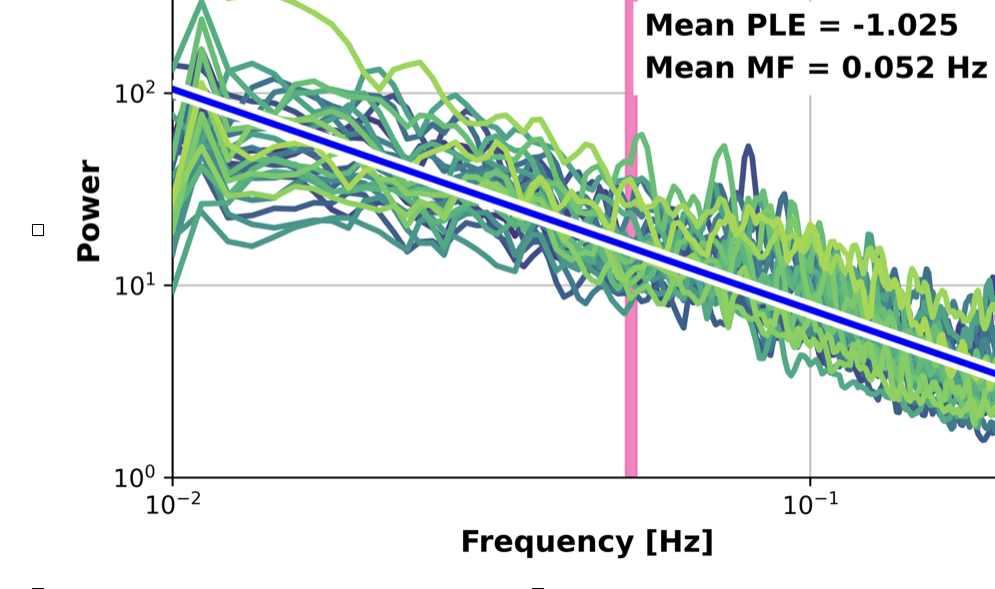
Every graph above shows one subject. As can be seen, the oscillation occurs for almost every subject.