Dear all,
I am a new AFNI learner. Recently, I am trying to preprocess macaque rsfmri data, however, some issues troubled me.
For resting-state fMRI data, the voxel resolution is 2.1875 x 3.1 x 2.1875 mm, TR is 2000ms. For T1 data, the voxel resolution is 0.2734 x 0.5 x 0.2734 mm, TR is 11.4ms.
I refered to afni's tutorial and used the following code to preprocess the data:
set dsets_NL_warp = ( result_sub-1001/sub-1001_anat_warp2std_nsu.nii.gz \
result_sub-1001/sub-1001_anat_composite_linear_to_template.1D \
result_sub-1001/sub-1001_anat_shft_WARP.nii.gz )
afni_proc.py \
-subj_id sub-1001 \
-blocks tshift align tlrc volreg blur mask scale regress \
-dsets sub-1001/func/sub-1001_task-rest_bold_corr.nii.gz \
-copy_anat result_sub-1001/sub-1001_anat_nsu.nii.gz \
-anat_has_skull no \
-anat_uniform_method none \
-radial_correlate_blocks tcat volreg \
-radial_correlate_opts -sphere_rad 14 \
-tcat_remove_first_trs 2 \
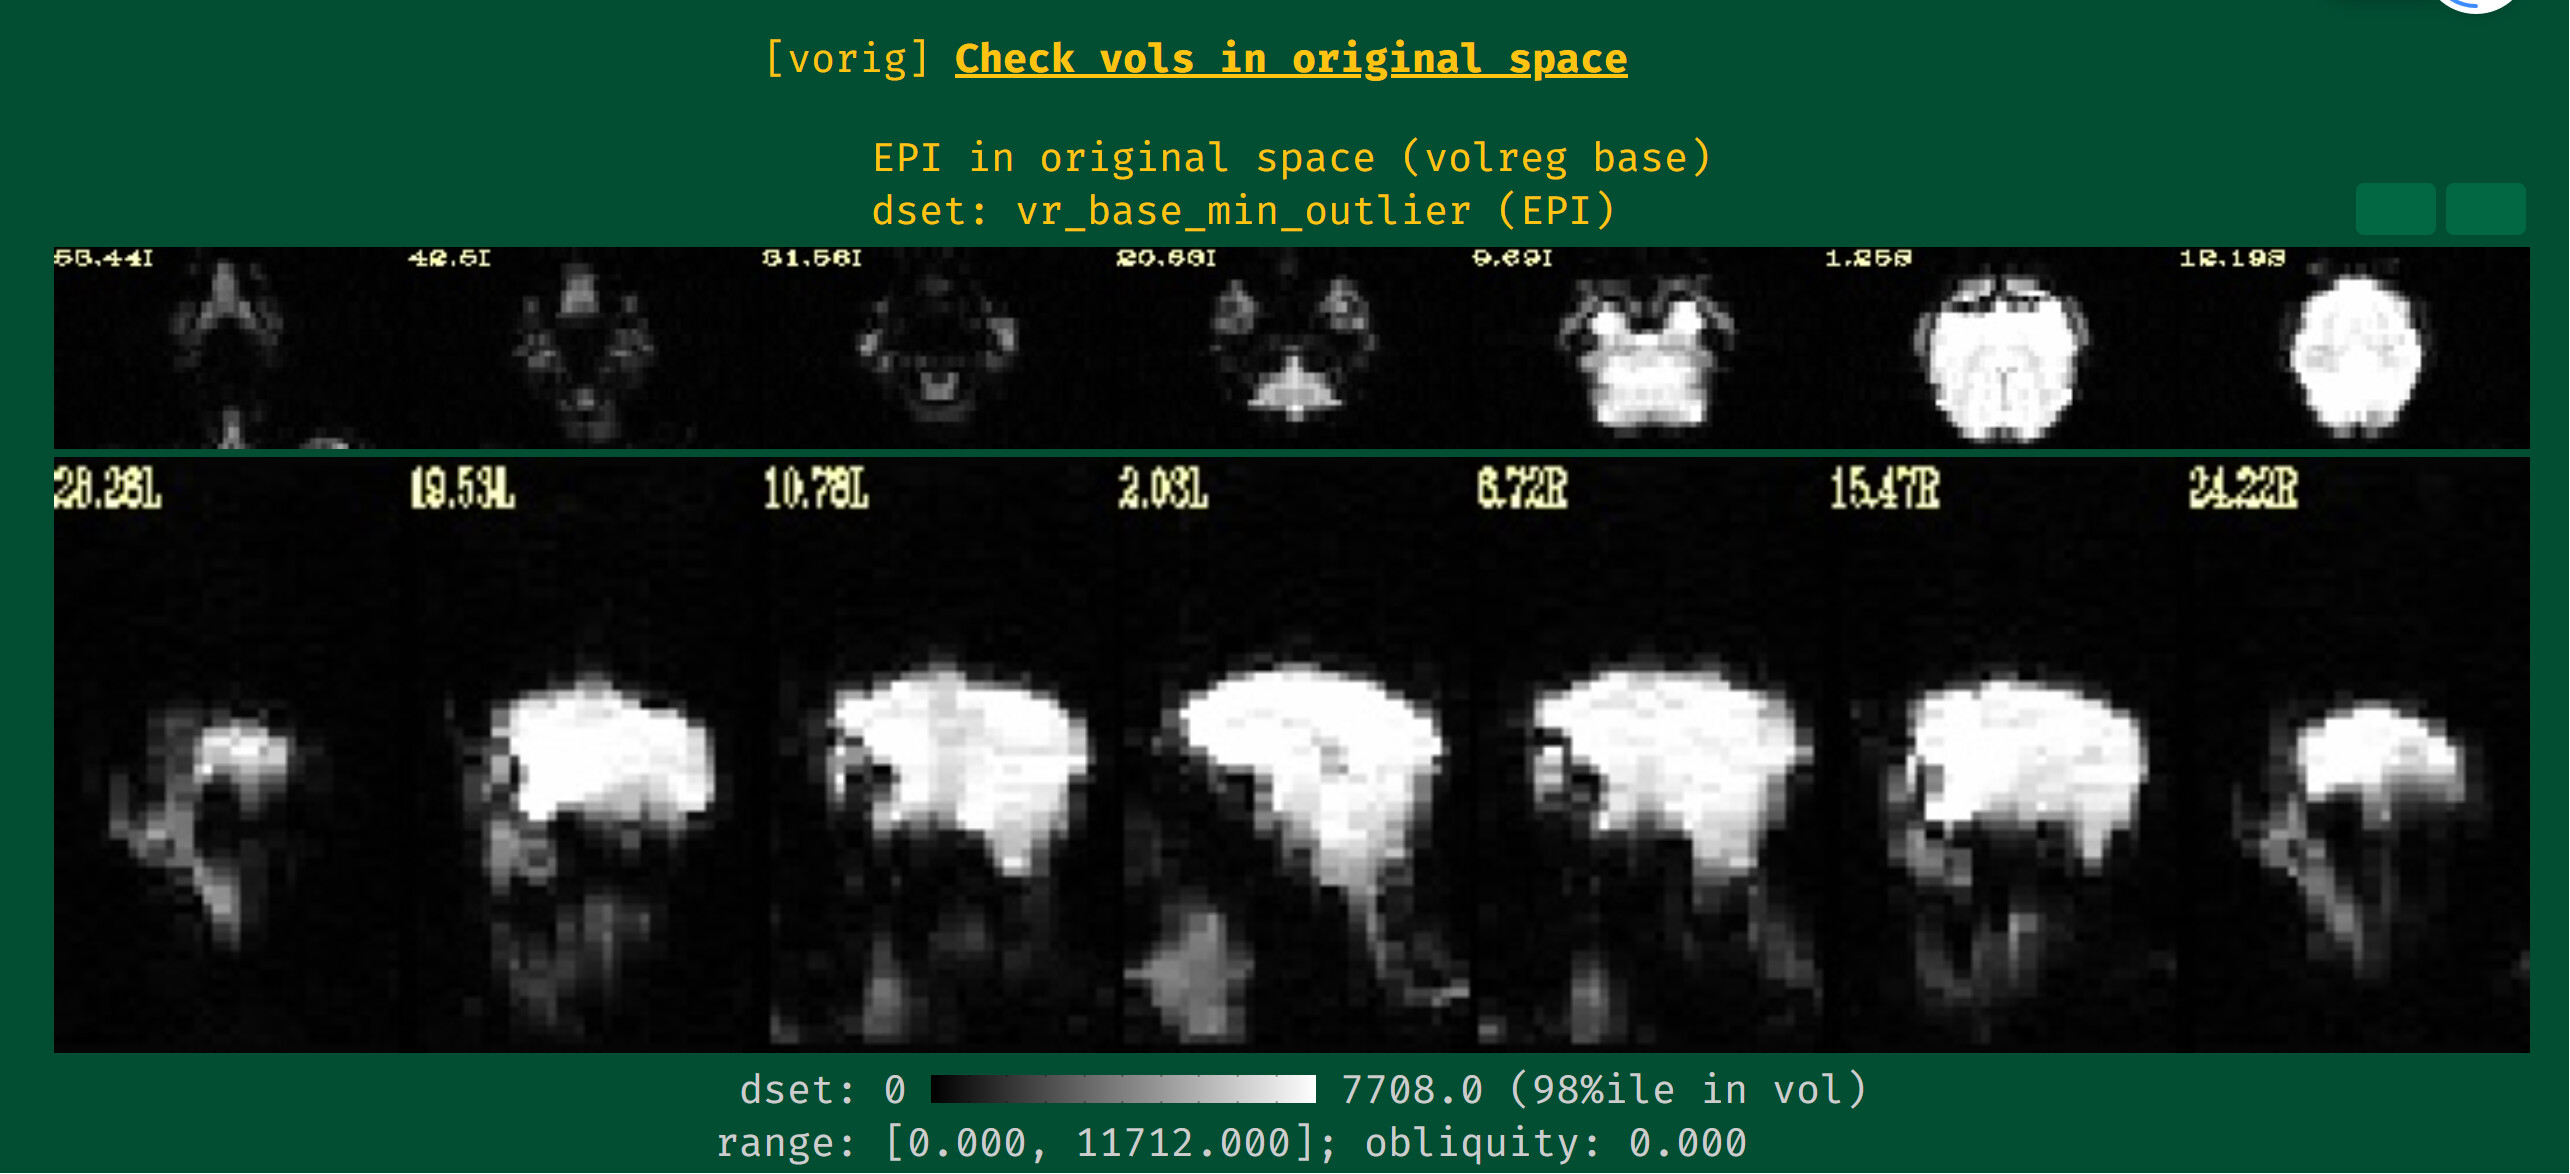
-volreg_align_to MIN_OUTLIER \
-volreg_align_a2e \
-volreg_tlrc_warp \
-volreg_warp_dxyz 1 \
-volreg_compute_tsnr yes \
-align_opts_aea -cost lpc+ZZ -giant_move \
-check_flip \
-align_unifize_epi local \
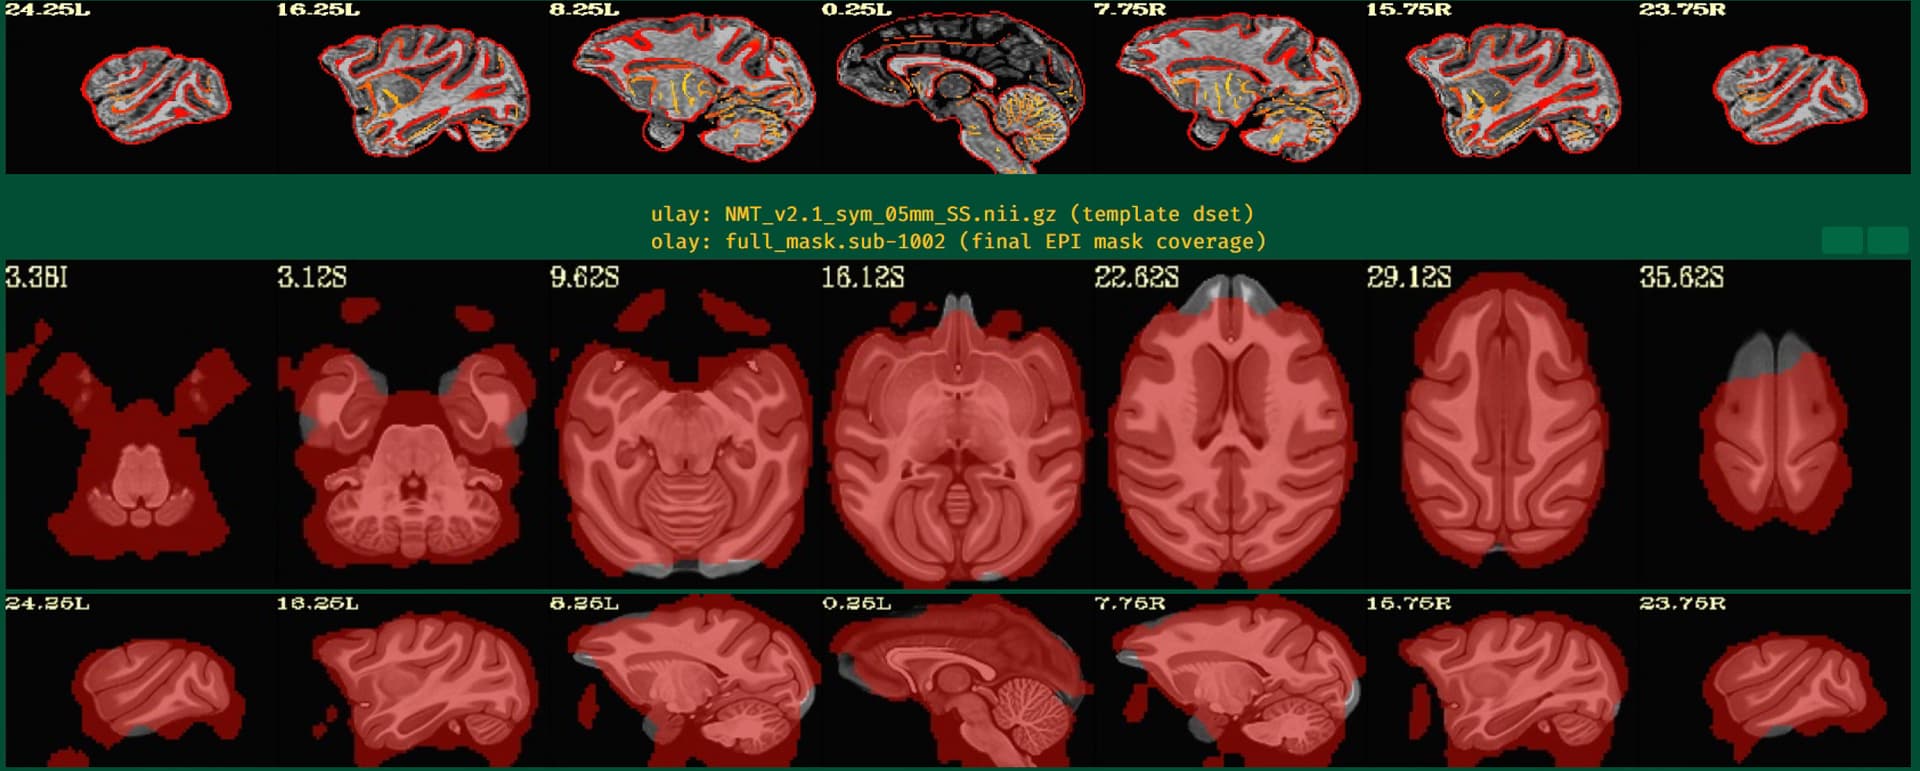
-tlrc_base ../NMT_v2.1_sym/NMT_v2.1_sym_05mm/NMT_v2.1_sym_05mm_SS.nii.gz \
-tlrc_NL_warp \
-tlrc_NL_warped_dsets ${dsets_NL_warp} \
-blur_size 2 \
-mask_segment_anat yes \
-mask_segment_erode yes \
-mask_import Tvent template_ventricles_1mm+tlrc \
-mask_intersect Svent CSFe Tvent \
-regress_ROI WMe Svent \
-regress_ROI_per_run WMe Svent \
-regress_motion_per_run \
-regress_apply_mot_types demean deriv \
-regress_censor_motion 0.2 \
-regress_censor_outliers 0.05 \
-regress_polort 2 \
-regress_bandpass 0.01 0.1 \
-regress_est_blur_errts \
-regress_est_blur_epits \
-regress_run_clustsim no \
-html_review_style pythonic
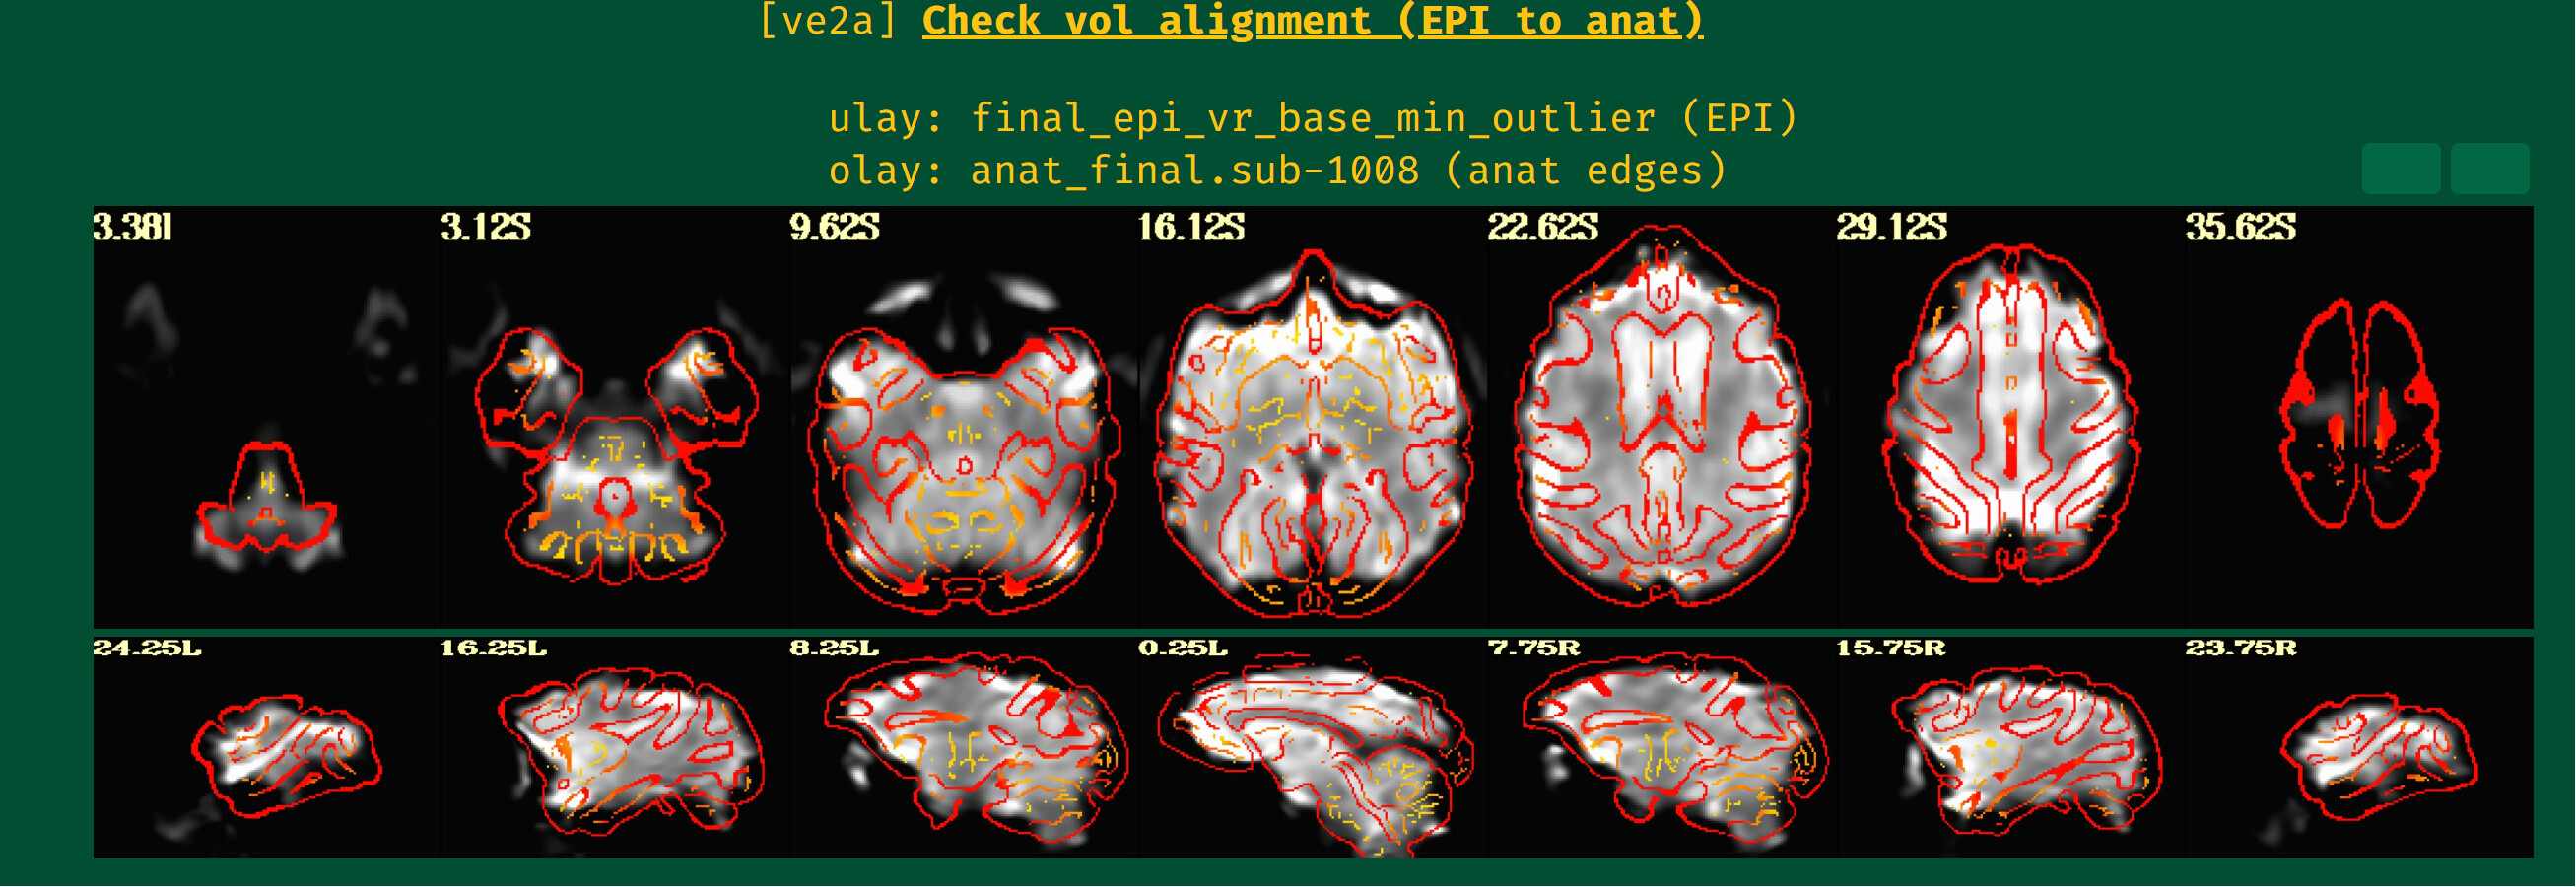
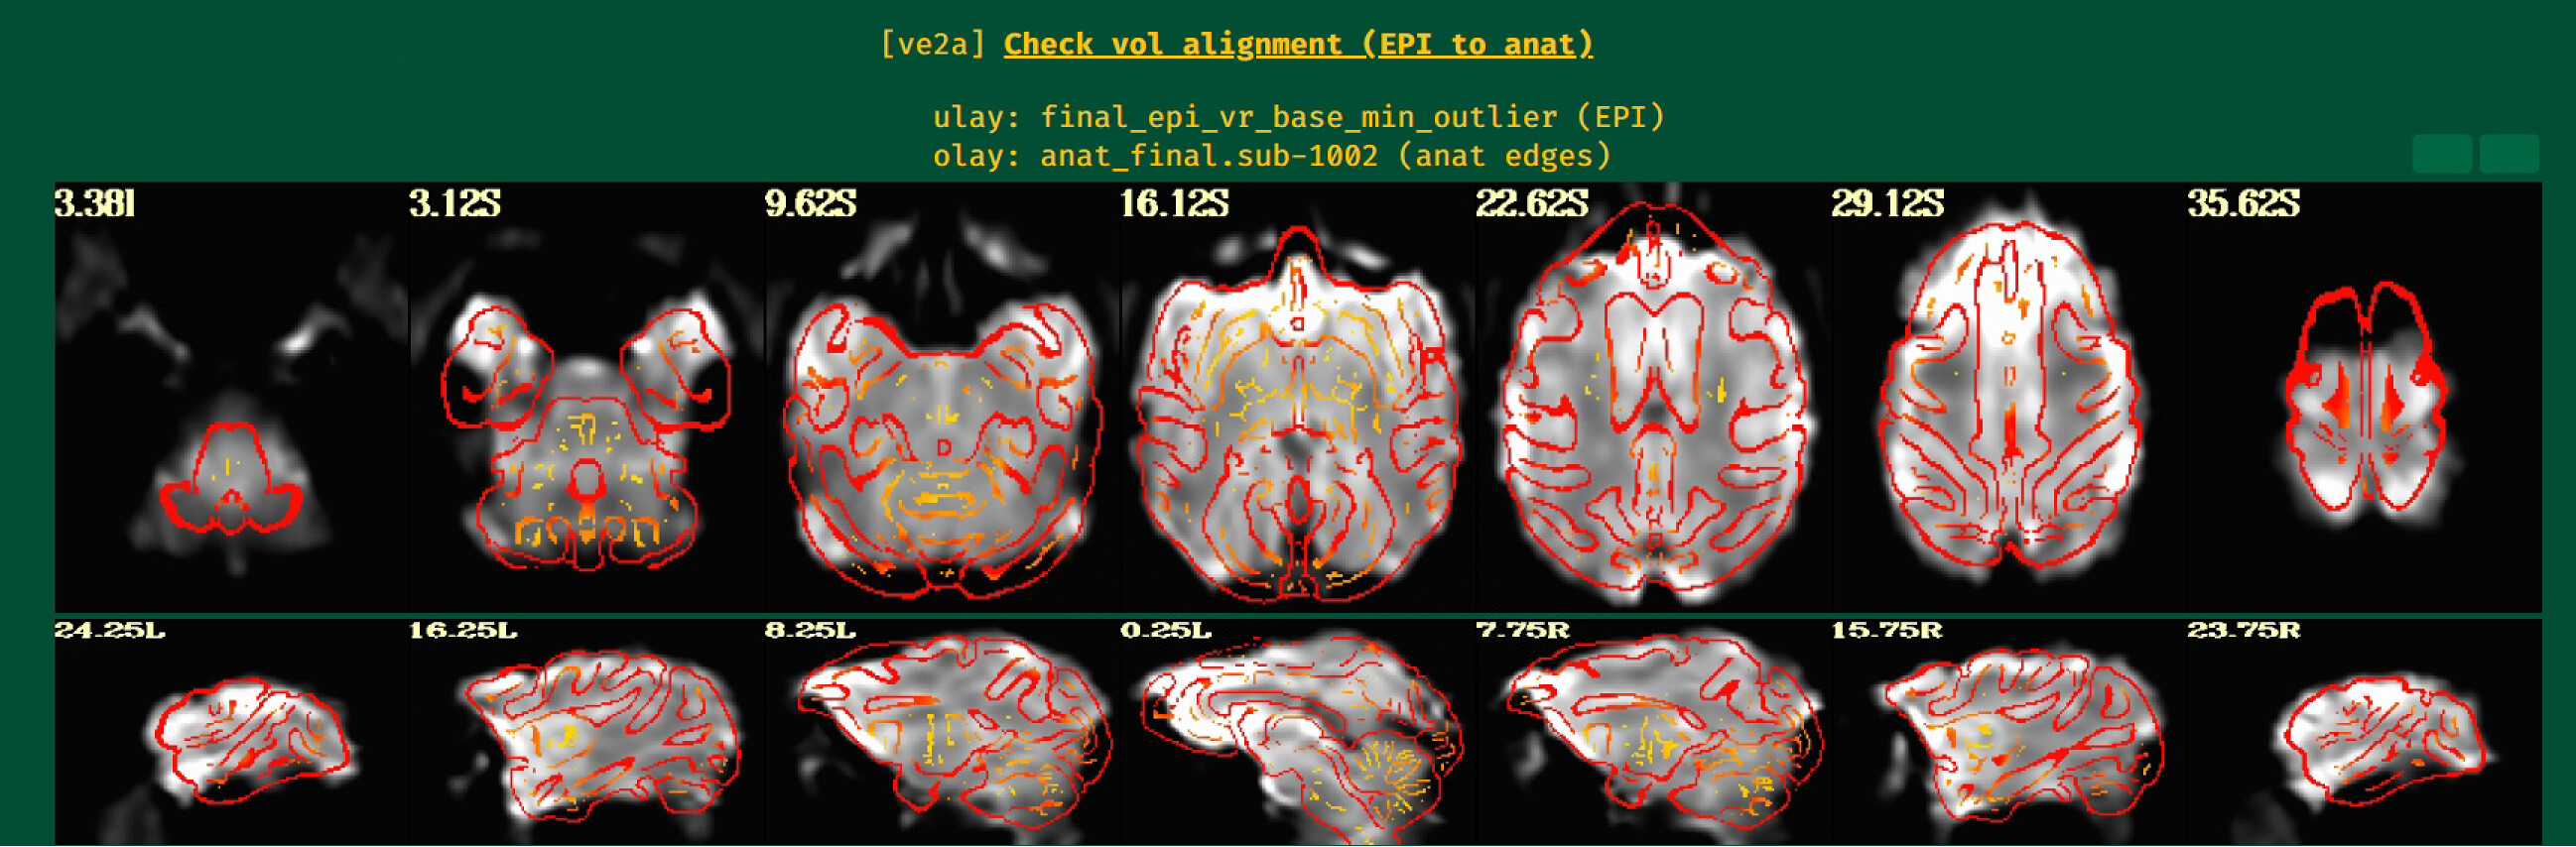
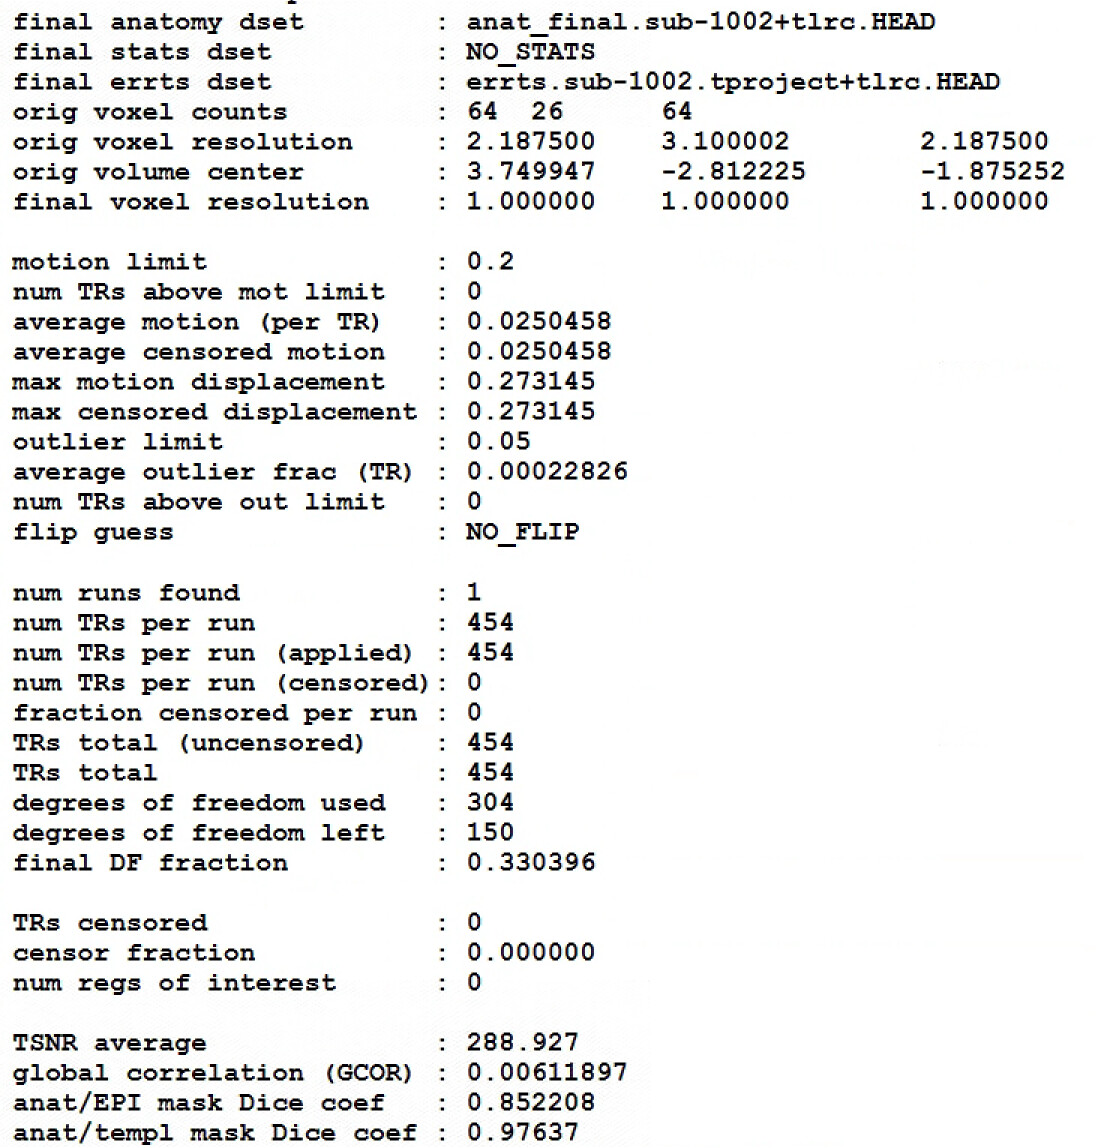
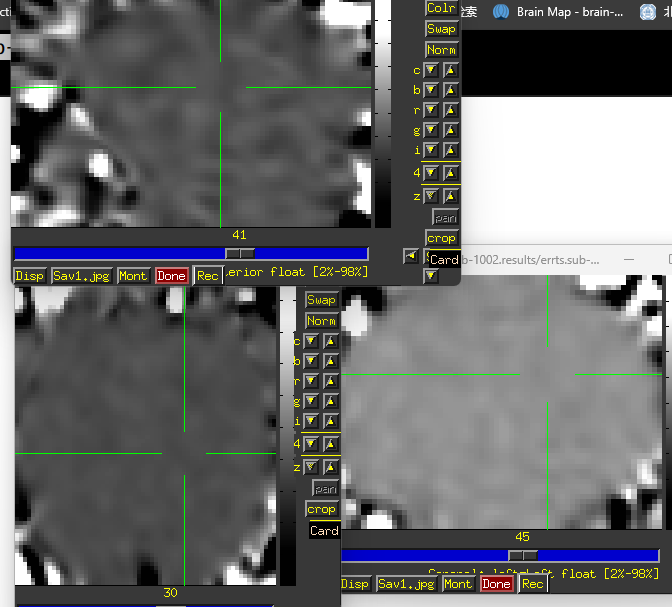
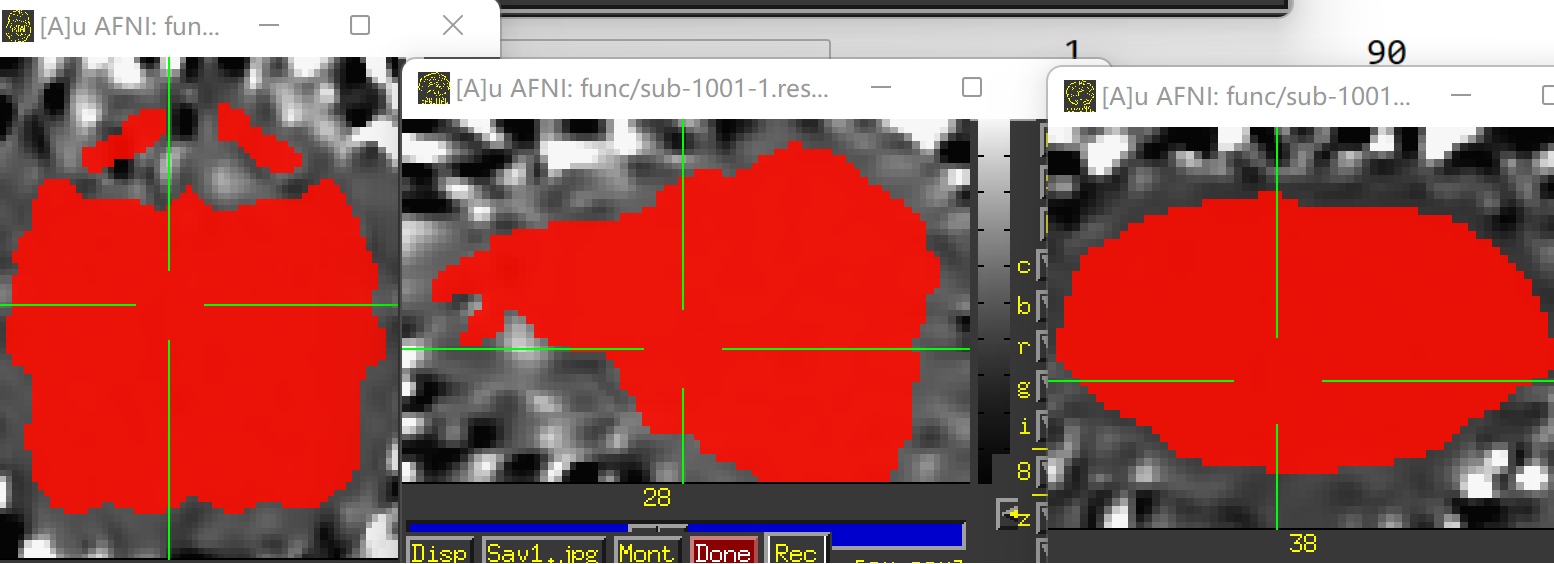
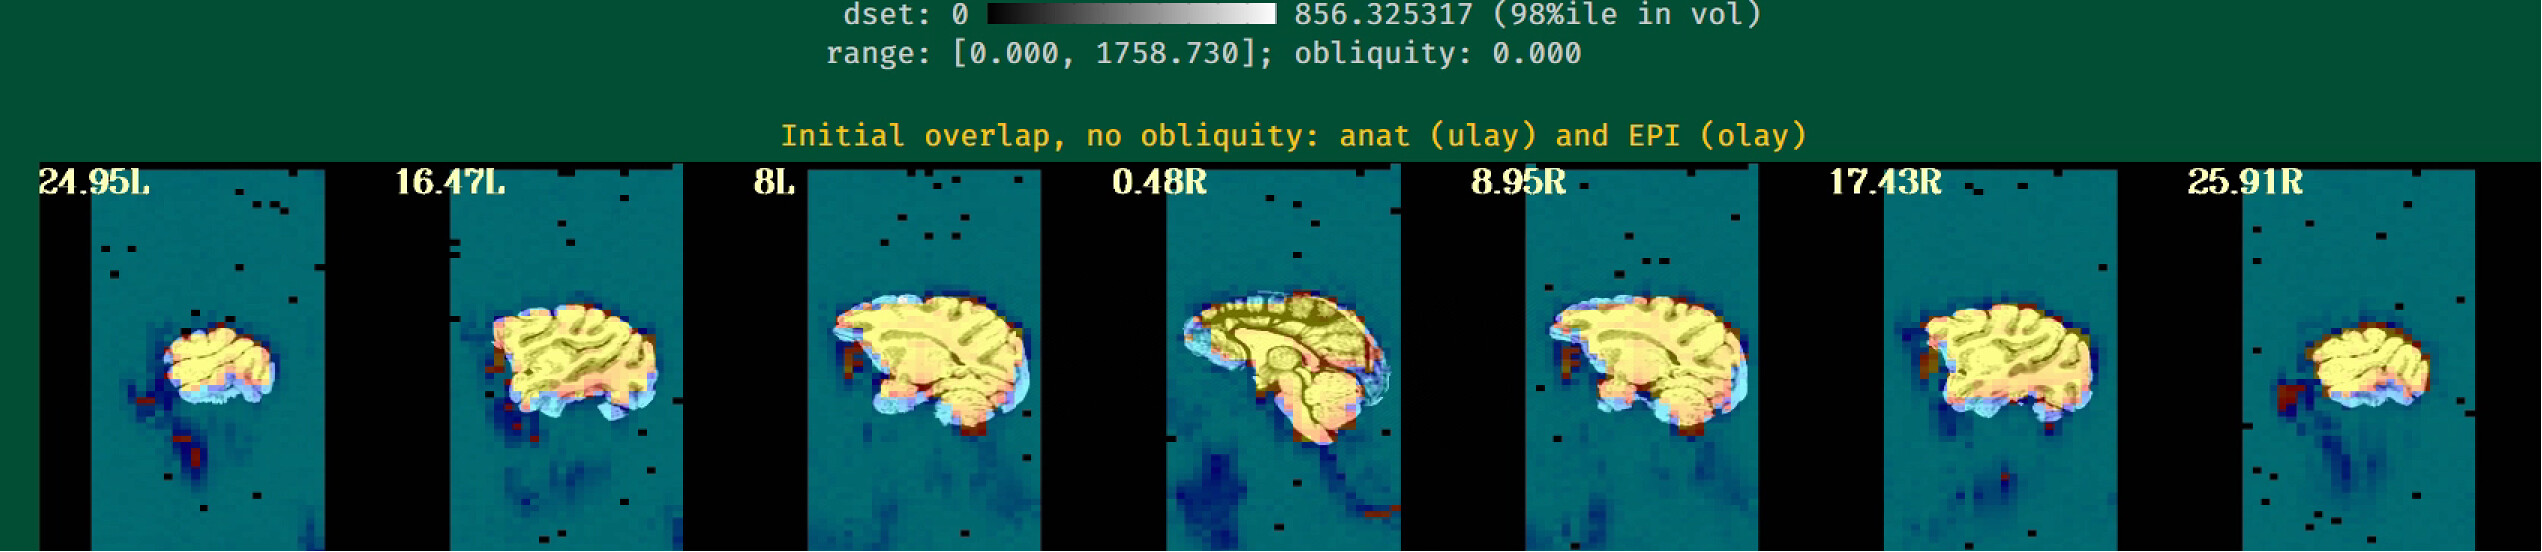
Unfortunately, the QC results showed that the alignment between anat and EPI is poor.
So I have some questions for my preprocessing process:
- How can I obtain fine alignment between anat and EPI and which parameters should I adjust?
- Is the code used for preprocessing appropriate? Sorry, I'm just getting started to learn afni.
- How can I estimate FD?
Best,
Ruilin