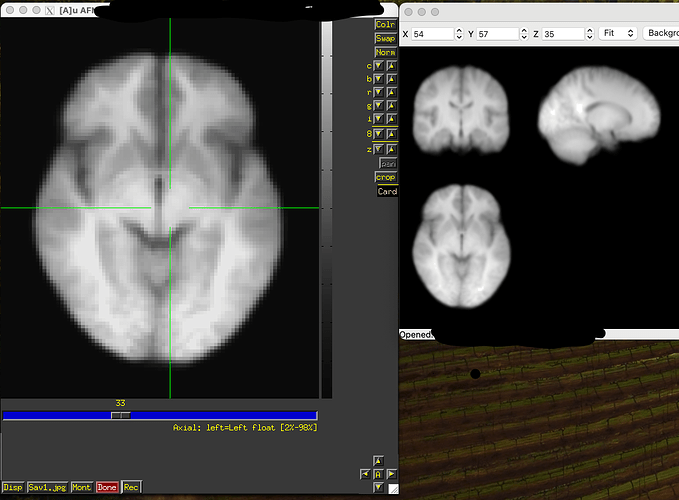
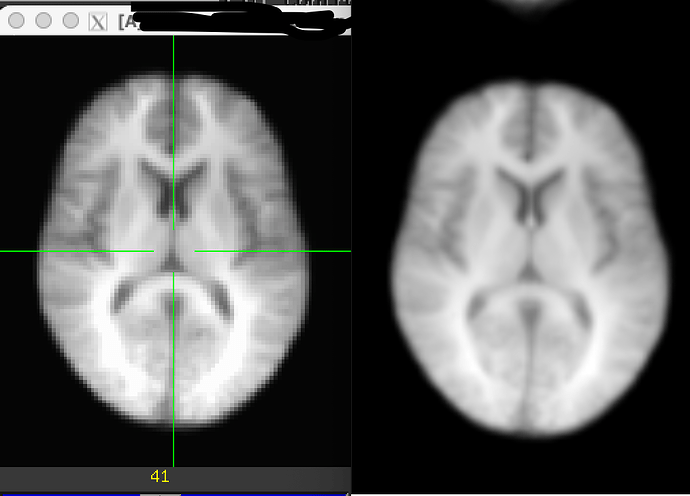
Thanks for sharing the dataset. There are a few things happening here.
I'm going to compare the shared dset, referred to and renamed to be shared_t1.nii.gz, that is visualized above, with the distributed template, MNI152_2009_template.nii.gz.
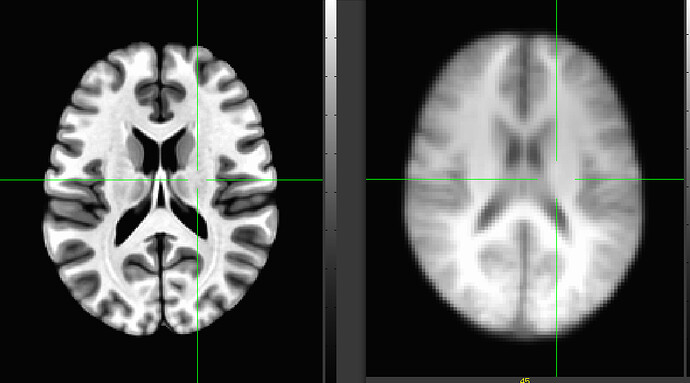
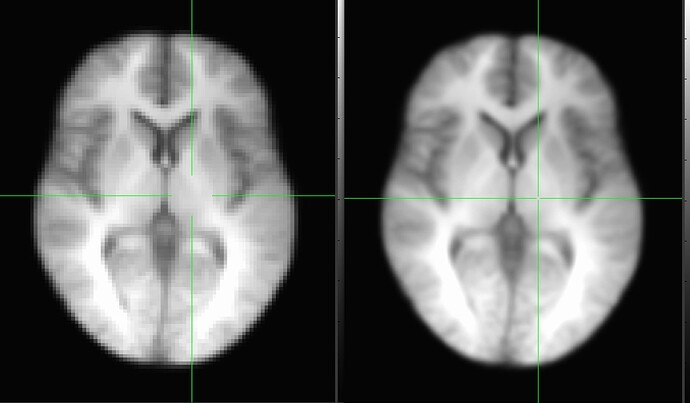
Let me first share picture of them for a similar, middle-ish slice of anatomy, where MNI is on the left and "shared" is on the right (sidenote: it is worth noting for a point below that it appears that the crosshairs are locked to the same coordinate here, but in fact they are not; these two panels are unlocked and I have just placed the crosshairs in a similar-ish anatomical location for each, to match visually):
This is just raw visualization in the GUI. The one on the left is sharper and has more tissue contrast, fine, but the voxel discreteness on the right is more apparent. That latter question is what got us started here.
First, if we compare voxels sizes, both, we see they are equal (1mm isotropic):
3dinfo -ad3 -prefix MNI152_2009_template.nii.gzshared_t1.nii.gz
1.000000	1.000000	1.000000	MNI152_2009_template.nii.gz
1.000000	1.000000	1.000000	           shared_t1.nii.gz
But, if we look at matrix dimension size, we see a big difference:
3dinfo -n4 -prefix  MNI152_2009_template.nii.gz shared_t1.nii.gz
193	229	193	1	MNI152_2009_template.nii.gz
91	109	91	1	           shared_t1.nii.gz
So, even though the brains appear to be the same size when we have the axial window edges lined up, in fact we are quite zoomed in when looking at the shared dataset.
We can compare the autobox size and output the min/max extent of the brain along each axis, and we see that for MNI:
3dAutobox -extent MNI152_2009_template.nii.gz
++ 3dAutobox: AFNI version=AFNI_24.2.02 (Aug 16 2024) [64-bit]
++ Auto bbox: x=25..168  y=25..205  z=6..160
Extent auto bbox: R=-72.000000 L=71.000000  A=-73.000000 P=107.000000  I=-72.000000 S=82.000000
... the RL brain extent is about 143mm, AP extent is 180mm and IS extent is 154mm.
The autobox extent for the shared dset is given by:
3dAutobox -extent shared_t1.nii.gz
++ 3dAutobox: AFNI version=AFNI_24.2.02 (Aug 16 2024) [64-bit]
++ Auto bbox: x=10..79  y=10..98  z=1..75
Extent auto bbox: R=-80.000000 L=-11.000000  A=-99.000000 P=-11.000000  I=2.000000 S=76.000000
... so the RL brain extent here is only (PT: edited to do the algebra of extents-math correctly now) 69mm, the AP extent is 88mm and IS extent is 74mm.
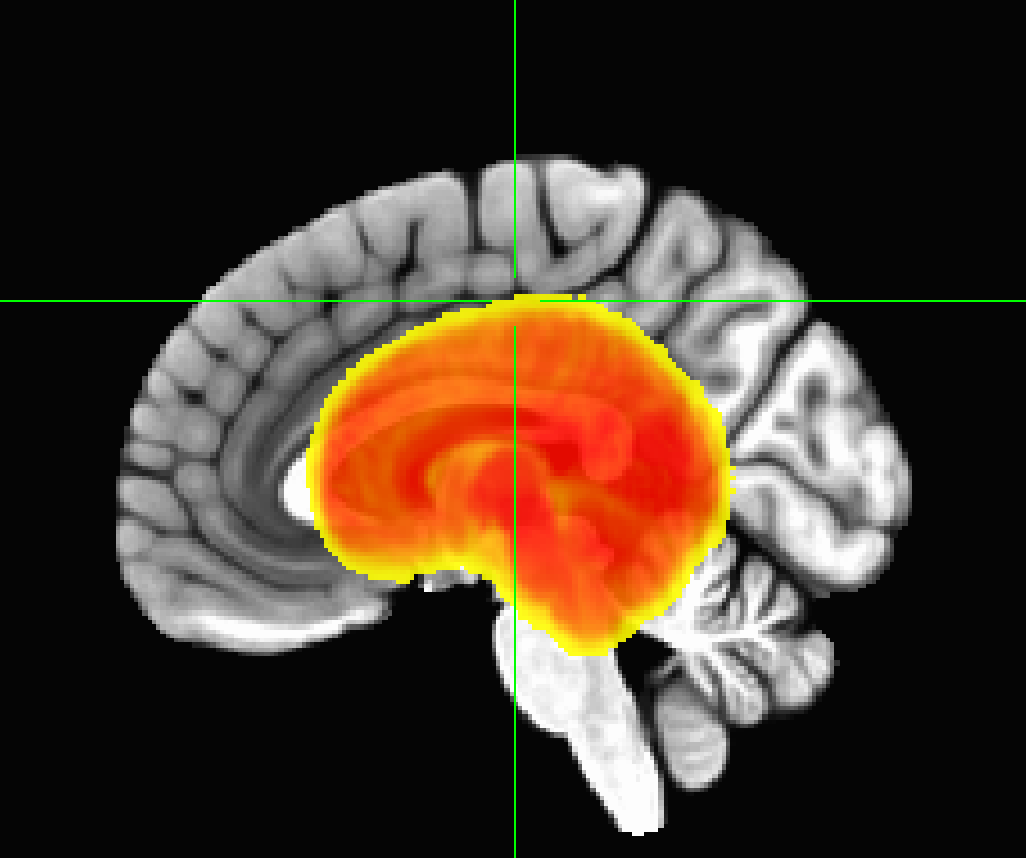
Effectively, this shared*.nii.gz dataset is only about (PT: edited to do the algebra of extents-math correctly now) 1/2 the size of the other one in each dimension (so meaning that one is about one eighth the size of the other), so using the same voxel size, we see that graininess more. If I overlay shared_t1 on MNI (as noted below, I have to fix qform_code and sform_code info and do a center of mass shift for shared_t1), you can see this size comparison:
So, seeing the voxels in this 1mm data is not a GUI problem, it is just a representation of the data as it is. If you would like to make the brain appear smoother, you could do the "define datamode" set of steps I mentioned above. Doing that and asking for cubic interpolation with upsampling to 0.1mm makes the shared dataset look like it does on the right here:
It is a data representation choice, but I prefer to deal with the data in the granularity in which it exists.
Separate issue
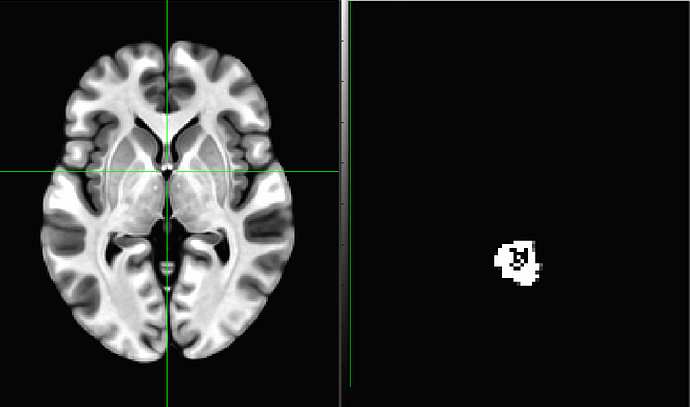
The coordinates and header information for this shared dataset are a bit odd. The coordinate origin (x,y,z)=(0,0,0) is not in a central-ish part of the brain (e.g., in the anterior commissure or near the center of mass), it is in fact in the corner of the dataset. If I lock the GUI windows together and jump to the coordinate origin for both the MNI and shared_dset, respectively, the crosshairs show where we are in the data:
This coordinate setup is typically not a desirable property in a reference dataset. This can be fixed/changed/altered, but if there are overlay datasets prepared in the same way, then those much be moved in same way to preserve grid overlap.
Also, if this is a reference space dataset, the NIFTI header information should typically reflect this. This is the dreaded terrain of the qform_code and sform_code. The TL;DR: code values of 3, 4 and 5 denote a reference volume; 1 denotes original space; 2 is the dreaded ambiguous one; and 0 means unknown. The values for the MNI template, a standard space reference, are in the expected range (MNI specifically is 4, by definition):
nifti_tool -disp_hdr -field qform_code -field sform_code -infiles MNI152_2009_template.nii.gz

N-1 header file 'MNI152_2009_template.nii.gz', num_fields = 2
  name                offset  nvals  values
  ------------------- ------  -----  ------
  qform_code           252      1    4
  sform_code           254      1    4
and those of this other shared_t1 reference are actually just 1, looking like an original space dataset:
nifti_tool -disp_hdr -field qform_code -field sform_code -infiles shared_t1.nii.gz

N-1 header file 'shared_t1.nii.gz', num_fields = 2
  name                offset  nvals  values
  ------------------- ------  -----  ------
  qform_code           252      1    1
  sform_code           254      1    1
This might be a more minor consideration, but it I just note it as a header feature. This, as well, would have to be updated in any accompanying files if it is altered/changed here.
--pt
