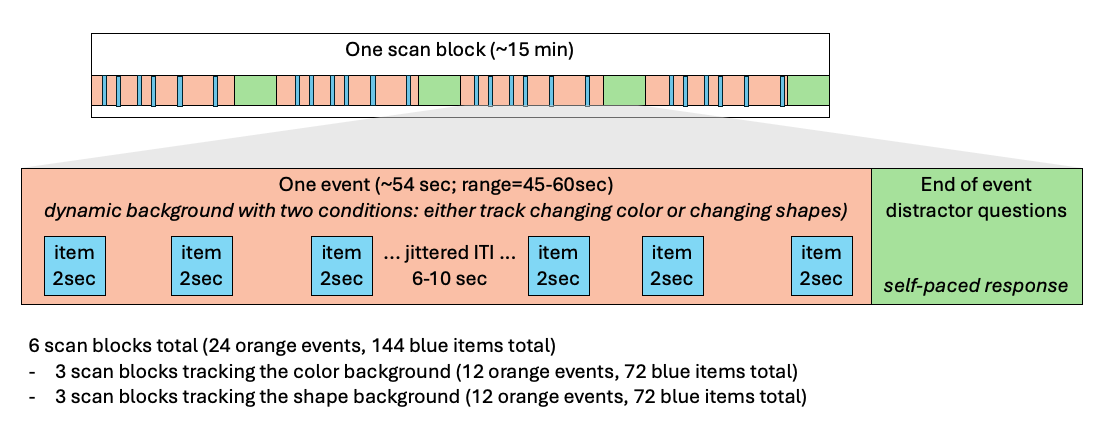
My task presents six object picture stimuli (2 sec duration) every 6-10 sec (jittered) during a long (~54 sec; range = 45-60 sec) event (i.e., background context). In each scan block, there are four events and 24 stimuli total, with events separated by distractor task questions (odd/even number judgements).
I want to look at activity evoked by the object picture stimuli, as well as during the longer event.
I am modeling the object picture stimuli in two different regressions (i.e., separate 3dDeconvolve commands) via: -stim_times object_timing.1D BLOCK(2,1) for univariate, and -stim_times_IM object_timing.1D BLOCK(2,1) for later use with 3dLSS for RSA analyses
and the inter-event distractors via: -stim_times distractorQ.1D GAM
but I am not sure how to best model the longer events.
I have considered TENT/CSPLIN(0,54,10) to track the signal over time (so, using 54 sec here, which is the mean duration of the event across all events and subjects; range = 45-60sec); this could potentially tell us if there are certain brain regions tracking the progress of this event. However, using the mean of 54 sec will not model the correct duration of each event.
I have also considered using dmBLOCK with a timing file that includes the duration of each event. This will appropriately model the correct duration of each model, but yields one beta for the entire event (i.e., lose out on assessing potential change occurring over time).
I want to look at the evoked activity during the items (i.e., blue squares in the figure) in a univariate analysis (model: BLOCK(2,1) as well as a multivariate (using stim_times_IM with BLOCK(2,1) ); these are two separate individual-level models, but in both, I want to appropriately model the orange event.
I also want to see which regions of the brain differ due to the task demands of the background event (i.e., orange square in figure; changing color/shapes). I originally planned on using TENT/CSPLIN and then plotting the knots over the duration of the event (maybe also use 3dMSS), but since the durations vary (range = 45-60), I wonder if I instead need to stick with dmBLOCK and not look at the change in signal over time.
I would also like to look at the connectivity during the background events (i.e., orange squares).
For the end-of-loop distractor questions, I am including a stim_timing file for the times the questions appear, and another stim_timing file for the response times. I am not analyzing the fMRI activity during the green square, but am trying to appropriately account for it in my models.
Thanks for clarifying the specifics of your experimental design.
For the end-of-loop distractor questions, I am including a stim_timing file for the times the questions appear, and another stim_timing file for the response times. I am not analyzing the fMRI activity during the green square, but am trying to appropriately account for it in my models.
What is the duration of the "end of the event" period with the distractor questions? Are you trying to treat the BOLD responses to both the appearance of the questions and the participant responses as two instantaneous events?
I also want to see which regions of the brain differ due to the task demands of the background event (i.e., orange square in figure; changing color/shapes). I originally planned on using TENT/CSPLIN and then plotting the knots over the duration of the event (maybe also use 3dMSS), but since the durations vary (range = 45-60), I wonder if I instead need to stick with dmBLOCK and not look at the change in signal over time.
Given that the object picture stimuli (the "blue squares") are already modeled, estimating the BOLD response to the background (the "orange rectangle") using TENT or CSPLIN would be quite challenging, aside from the issue of varying durations. I agree that, while less precise, it may be more practical to model the background as a constant and estimate it using dmUBLOCK. For some nuances, see this documentation.
The "end of event" period includes 15 questions. Each are presented for 2sec before a response period begins (self-paced, most people are responding with 1-3 sec). I was treating them as two separate instances to account for the visual and then motor response. Using 1d_tool.py -infile X.xmat -show_cormat_warnings does indicate that those questions and responses have high co-linearity (~.9).
I'll look into using dmUBLOCK instead of dmBLOCK, in order to estimate the orange background for the individual-level models where I am estimating the "blue square item" trials (for univariate and later MVPA analyses). Since there is no response time in the orange events, it looks like I would just use dmUBLOCK with no parameters (dmUBLOCK(0)), correct?
What are your thoughts on running another individual-level model that does not model the blue items, but uses a TENT to model the long orange event. Maybe TENT(-1.5,66,46) (or TENT(-1.5,66,12) to avoid overfitting) to capture the TR before the orange event begins and several TRs after it ends. 66 sec would capture quite a bit after slower orange events that are on the slower end however (i.e., bleed well into the end of event distractor questions).
I am also considering running an individual-level model that ignores the orange events, and then using the residuals to look at differences in connectivity between the two orange event conditions (changing shapes vs colors).
The "end of event" period includes 15 questions. Each are presented for 2sec before a response period begins (self-paced, most people are responding with 1-3 sec). I was treating them as two separate instances to account for the visual and then motor response. Using 1d_tool.py -infile X.xmat -show_cormat_warnings does indicate that those questions and responses have high co-linearity (~.9).
That level of collinearity is likely not a major concern; it's more important to ensure that the model adequately captures the expected effects in the data.
What are your thoughts on running another individual-level model that does not model the blue items, and uses a TENT to model the long orange event. Maybe TENT(-1.5,66,46) or (TENT(-1.5,66,12) to avoid overfitting) to capture the TR before the orange event begins and several TRs after it ends. 66 sec would capture quite a bit after slower orange events that are on the slower end however (i.e., bleed well into the end of event distractor questions).
There are two key considerations when deciding whether to use the TENT basis for estimation. First, does it provide a more effective way to address your research questions? Second, are you still modeling the "end of event" period? If so, could signal overlap ("bleeding") introduce challenges for estimation or interpretation due to high collinearity?
If I use TENT to model the orange periods, I would still model the end of block questions and responses.
Maybe running an individual-level model that ignores the orange events (ie just models the blue items and the end of block), and then using the residuals to look at differences in connectivity between the two orange event conditions (changing shapes vs colors) will be a better way to contrast the orange event conditions.
Maybe running an individual-level model that ignores the orange events (ie just models the blue items and the end of block), and then using the residuals to look at differences in connectivity between the two orange event conditions (changing shapes vs colors) will be a better way to contrast the orange event conditions.
While not ideal, it’s still valuable to compare these different modeling strategies and see how they perform relative to one another. I'm sure you’d agree that such modeling challenges are often more effectively addressed during the experimental design stage, rather than being left to post hoc adjustments during analysis.
Totally - I didn't think about looking at the longer events until after the fact, and now I have my heart set on it!
The
National Institute of Mental Health (NIMH) is part of the National Institutes of
Health (NIH), a component of the U.S. Department of Health and Human
Services.