Howdy-
Thanks for the questions, and for posting your full AP command for clarity.
I noticed there was a kind of comment inserted in it in line 13: --> large move. Is that a question for us, about whether that would be useful? In general, for datasets that have "well converted" coordinates---i.e., where the EPI and anatomical have strong initial overlap, and the coordinate origin (x,y,z)=(0,0,0) is fairly central in the brain---then using -large_move instead of -giant_move makes sense. The only difference between them is that -giant_move includes a pre-step of using the center-of-mass of the anatomical and EPI datasets for a pre-adjustment, which used to be necessary when DICOM conversion was less problematic and actual coordinates were often lost.
I have taken the liberty of copying your AP command, removing the comment, and running it through a vertical-alignment function, just for to help me see the options+arguments more easily:
afni_proc.py \
-subj_id sub_010_postop \
-script proc.sub_010_postop_clean_no_scrub_remove5TR \
-scr_overwrite \
-blocks tshift blip align tlrc volreg mask blur scale \
regress \
-copy_anat anat/sub-010_ses-postop_T1w.nii.gz \
-dsets func/sub-010_ses-postop_task-rest_bold.nii.gz \
-blip_forward_dset fmap/sub-010_ses-postop_dir-AP_epi.nii.gz \
-blip_reverse_dset fmap/sub-010_ses-postop_dir-PA_epi.nii.gz \
-blip_opts_qw -plusminus \
-tcat_remove_first_trs 5 \
-align_unifize_epi local \
-align_opts_aea -cost lpc+ZZ \
-giant_move \
-check_flip \
-tlrc_base /home/lozano/abin/MNI152_2009_template_SSW.nii.gz \
-tlrc_NL_warp \
-volreg_align_to MIN_OUTLIER \
-volreg_align_e2a \
-volreg_tlrc_warp \
-blur_size 4.0 \
-mask_epi_anat yes \
-regress_motion_per_run \
-regress_apply_mot_types demean deriv \
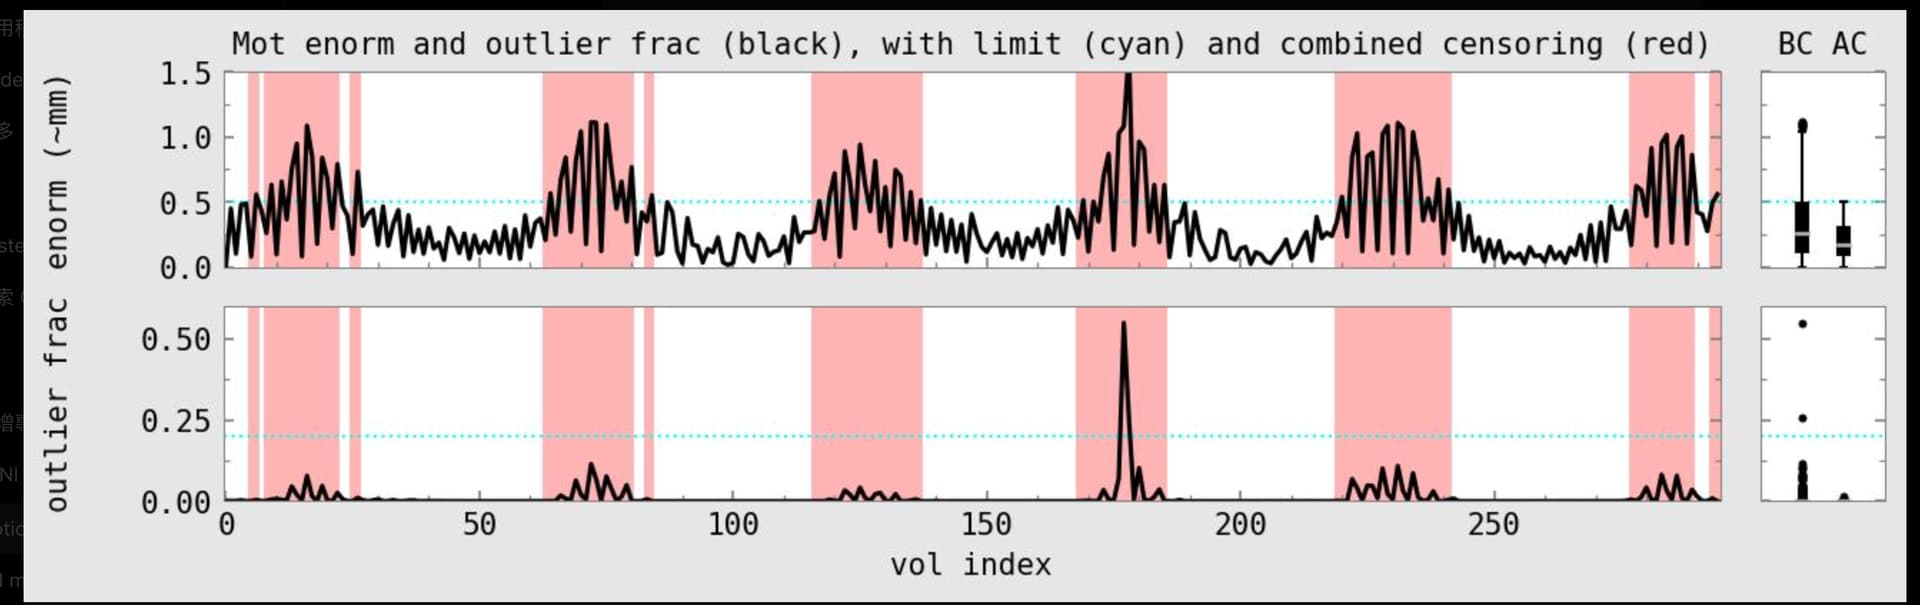
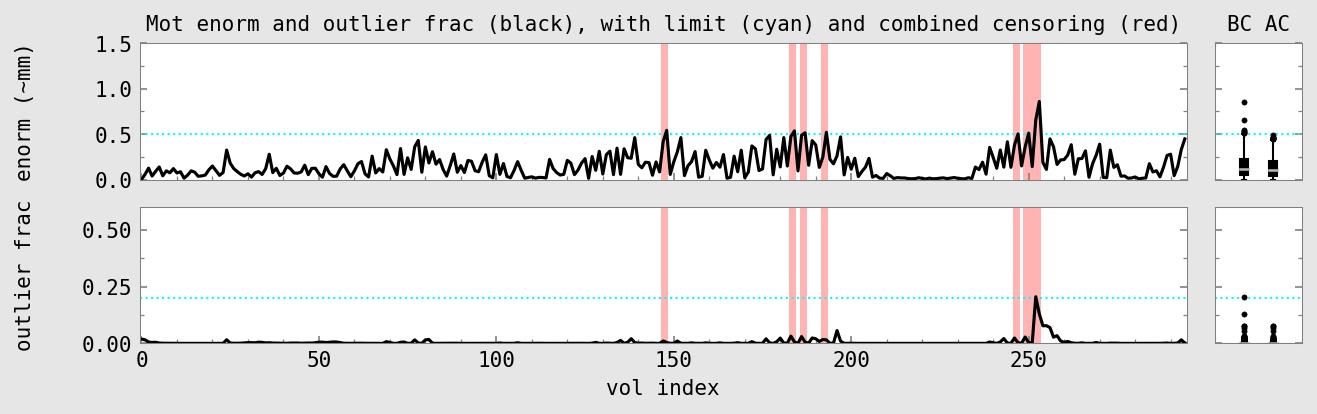
-regress_censor_motion 2.0 \
-regress_censor_outliers 0.2 \
-regress_est_blur_epits \
-regress_est_blur_errts \
-regress_run_clustsim no \
-html_review_style pythonic
OK, to your questions:
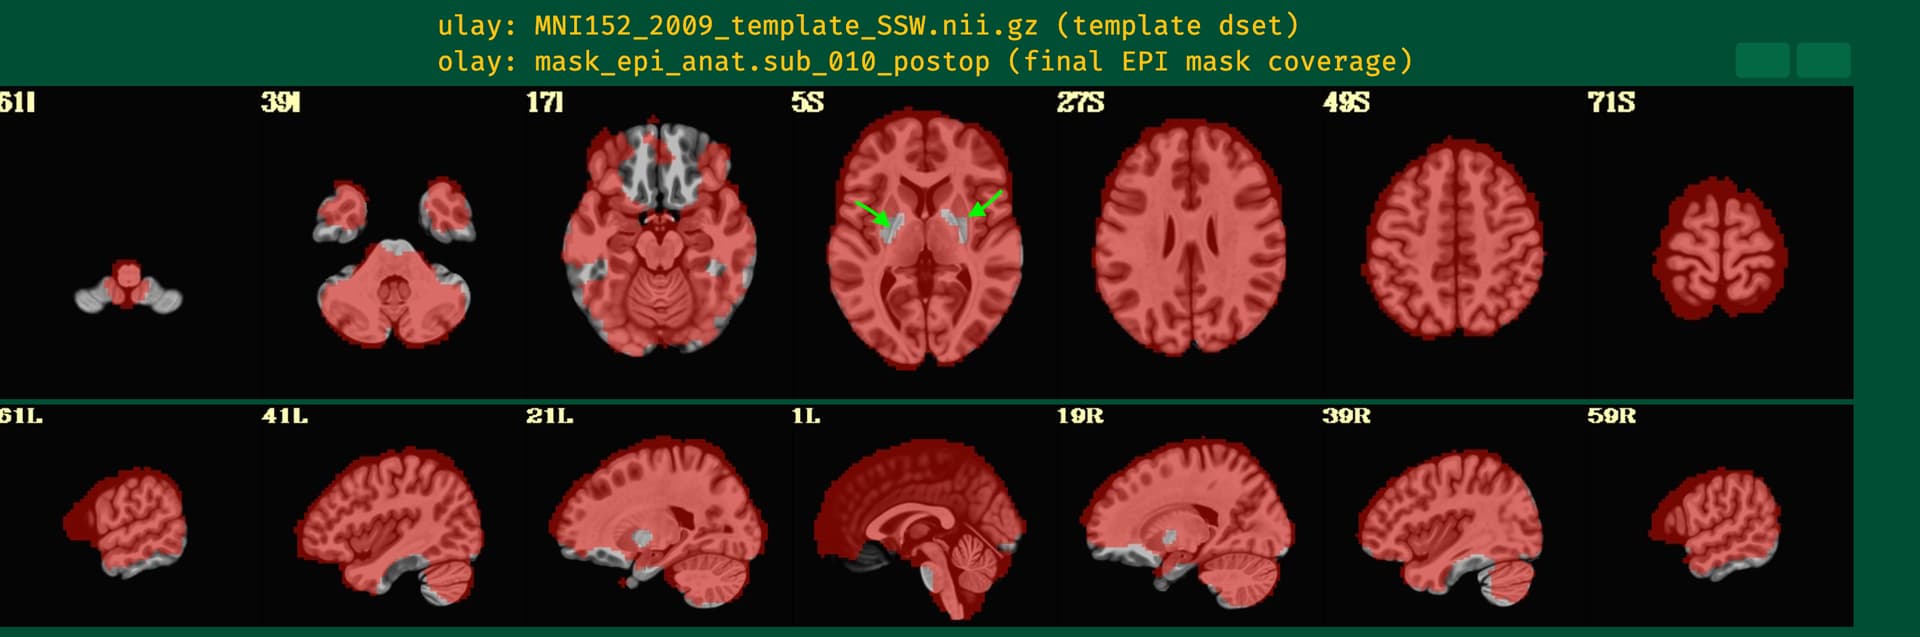
Q1: That image shows the results of automasking the EPI (and combining that mask with the anatomical, as we generally recommend, using -mask_epi_anat yes). What appear to be holes there are likely just the "mountain tops" of low signal regions from the EPI acquisition, whose base you can see in more inferior slices, like in 17I, and also in the sagittal views in the lower row. It is quite, quite, quite common for EPI data to have weak signal there, since the middle of the brain is far from coils and particularly due to magnetic distortion effects from sinuses. I don't know how many studies publish on those regions without acquiring data in specially focused ways, frankly. It is something that we see a lot, and it is an important part of QC to make sure that you have strong signal in regions you care about. That is why we include the TSNR map and TSNR/region table in the APQC HTML, as well. Those are described here, if you search for TSNR. It was also something that came up in the FMRI Open QC Project in a number of places.
This is another example of why looking at data is so important... Glad you are doing so and checking about it. While there are EPI measured values there, they are typically so low that they don't make threshold to be included in an EPI mask. You can check the TSNR values there, too, but they will likely be so low as to not really be useful.
You can look at the ve2a image, which shows EPI-anatomical alignment, in the APQC HTML just above that. That is how you should judge the quality of EPI-anatomical alignment. Assuming it is good---by seeing where the anatomical structural/tissue outlines match well underlying EPI features---then I think you will probably also see that the EPI itself appears quite dark in those regions. That reflects the very low value of signal intensity, and that will be reiterated in the TSNR plots also in the HTML.
We discuss how you can add your own map of regions of interest (even if you aren't doing an ROI-based study, which I assume you are not because you have included blurring in the processing) in this paper if you search for "A table of TSNR and ROI shape properties". I would pretty much always recommend including something like that, to help you judge if the locations you most care about for your study have reasonable signal to analyze.
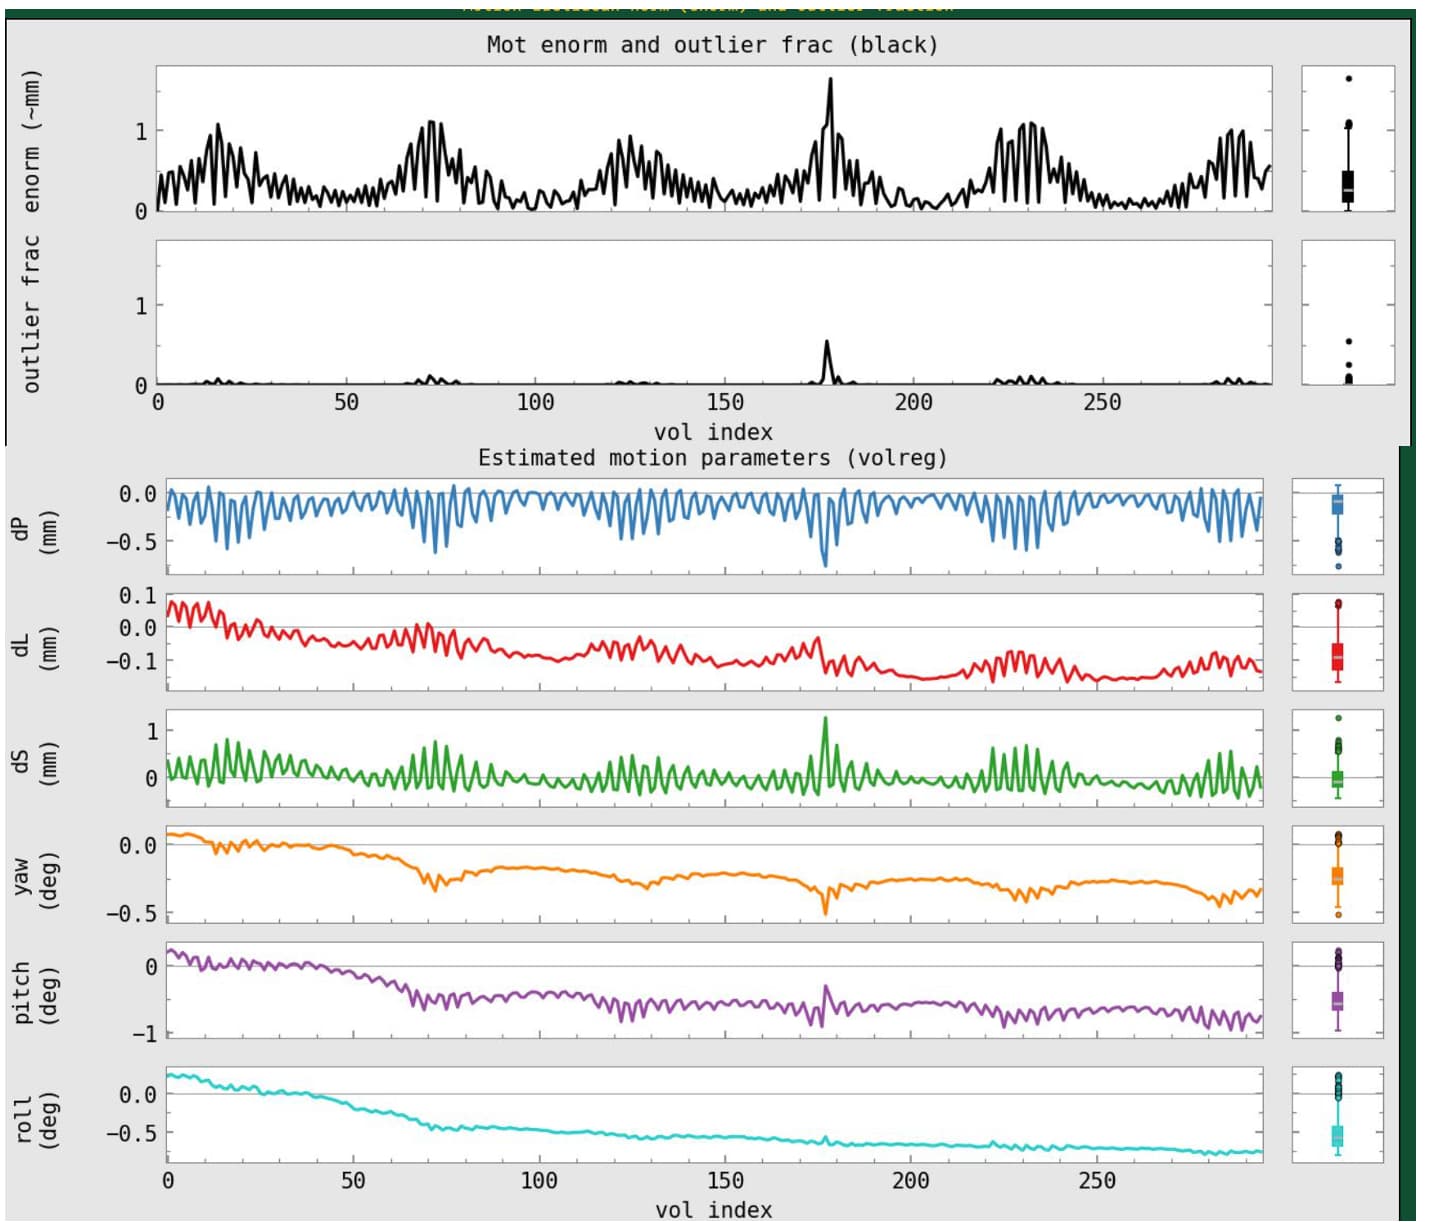
Q2: Re. motion: well, this is probably the most open-ended area of FMRI processing. There are different schools of thought, with valid arguments, and it is primarily important to be consistent. This is a valuable resource for thoughts on motion in FMRI processing, among others.
It looks like you have resting state or naturalistic data, because you don't have task stimuli. In that case, getting ridding of motion is particularly important, because features due to motion that are left in after processing will artificially boost/change standard correlation-based analyses. Sometimes people with particularly motion-prone populations do just decide to use higher thresholds and acknowledge that there is more motion contamination. It is indeed tricky, and there is no "best" solution. Using lower thresholds is more strict in protecting against motion, but then one can lose out on lots of data, even to the point of removing subjects, and that can introduce its own biases and data waste into the equation.
Whatever threshold you use, you want to be confident that motion is not determining the majority of results. The APQC seedbased correlation maps help with this, to show whether you have artificial patterns in the data or not. The GCOR estimates and corr_brain maps also help. Using InstaCorr will be particularly valuable, to surf through some datasets (see also note below on AFNI setup+HTML functionality). These are all detailed more in here and here.
I might put @rickr on the spot for an opinion year, as he has worked on many different kinds of datasets with varied motion levels.
A separate note about AFNI setup:
I see in your APQC HTML snapshot that there are two dark buttons above the upper-right corner of the image. I assume this is because you opened the HTML either without open_apqc.py or your computer does not have the "flask" and "flask_cors" modules installed. You will find it really helpful to enable that functionality, because then those buttons will be active, and you can open the data in question in the AFNI GUI at the click of a button. And you will get access to InstaCorr (the "IC" button above several images, like vstat), and you will get to save QC comments+ratings
automatically. Please see here in the AFNI Academy YouTube channel for more details on this, and on the APQC HTML overall, and here for a quick poster overview from OHBM a few years ago, and the above-linked QC-features-in-AFNI papers.
A separate note about AP choices:
Most of your options look great and what I would choose. One thing I would likely adjust is how you include nonlinear alignment to the (MNI) template. With your current options, nonlinear alignment will be run every time you run (and re-run) AP, which will be slow, and it will be using auto_warp.py, which is an OK but older wrapper for 3dQwarp. Your anatomical dataset is also being skullstripped within AP, using 3dSkullStrip, which is pretty good but not the best option.
Instead, we generally recommend running sswarper2 prior to AP, and then providing its results into the AP command. This is a more modern wrapper of 3dQwarp, which will generally do a better/more reliable job than auto_warp.py. It will also skullstrip your anatomical dset at the same time (the "ss" part of the program name), in a generally more reliable way. So, you would run sswarper2, and then provide its results like done in this AP example, with the following options added/used:
# ... ones about the anatomical:
    -copy_anat                   ssw/anatSS.sub-005.nii              \
    -anat_has_skull              no                                  \
    -anat_follower               anat_w_skull anat                   \
                                 ssw/anatU.sub-005.nii               \

# ... ones about the warp:
    -tlrc_base                   MNI152_2009_template_SSW.nii.gz     \
    -tlrc_NL_warp                                                    \
    -tlrc_NL_warped_dsets        ssw/anatQQ.sub-005.nii              \
                                 ssw/anatQQ.sub-005.aff12.1D         \
                                 ssw/anatQQ.sub-005_WARP.nii         \
And, for a bit extra QC features/outputs, I would probably also add these options to your AP command:
# for extra images in the APQC HTML
    -radial_correlate_blocks     tcat volreg regress                 \
    -volreg_compute_tsnr         yes                                 \
Sorry for the long reply---hope some of that might be useful!
--pt