AFNI version Precompiled binary macos_13_ARM: May 8 2025 (Version AFNI_25.1.08 'Maximinus')
Say I want to compare the effects of regressing out a covariate at the group level. I do an analysis (say, 3dLMEr) and I get 20 subbricks with the covariate regressed out (there's a Chi-sq subbrick that corresponds) along with all the other stats subbricks. Then I do the analysis again without the covariate and I get 19 subbricks (missing only the covariate).
When viewing results in the AFNI GUI I like to flip between overlay files, but in the above example the GUI retains the subbrick number in its display but those numbers no longer correspond between analyses. So basically it's a bunch of clicking and/or screenshotting, and or 3dcalc-ing so i can get back-to-back views.
I see options like "Thr = Olay" or "Thr = Olay+1" which are kind of in the ballpark, but there's no way to do this with the GUI (or an env var), right?
I think internally the label gets translated to a subvolume index, so the label is just a temporary convenience, as it were.
If it were me, in this case I would probably loop over all subj, extracting the desired volume(s) in each case with the labels into consistently-index temporary dsets, and then view those intermediate datasets easily with the GUI, rather than be frustrated.
Just to be sure anyone watching knows, the afni GUI can show multiple controllers, so one could show one sub-brick volume in one controller as the color overlay and a different one in another controller. Up to 10 controllers are allowed. As long as "time lock" is off (the default), then the index will be separately controlled.
You could also drive afni to switch datasets and save images. Even use 2dcat to concatenate the images together in pairs. View these with aiv or eog.
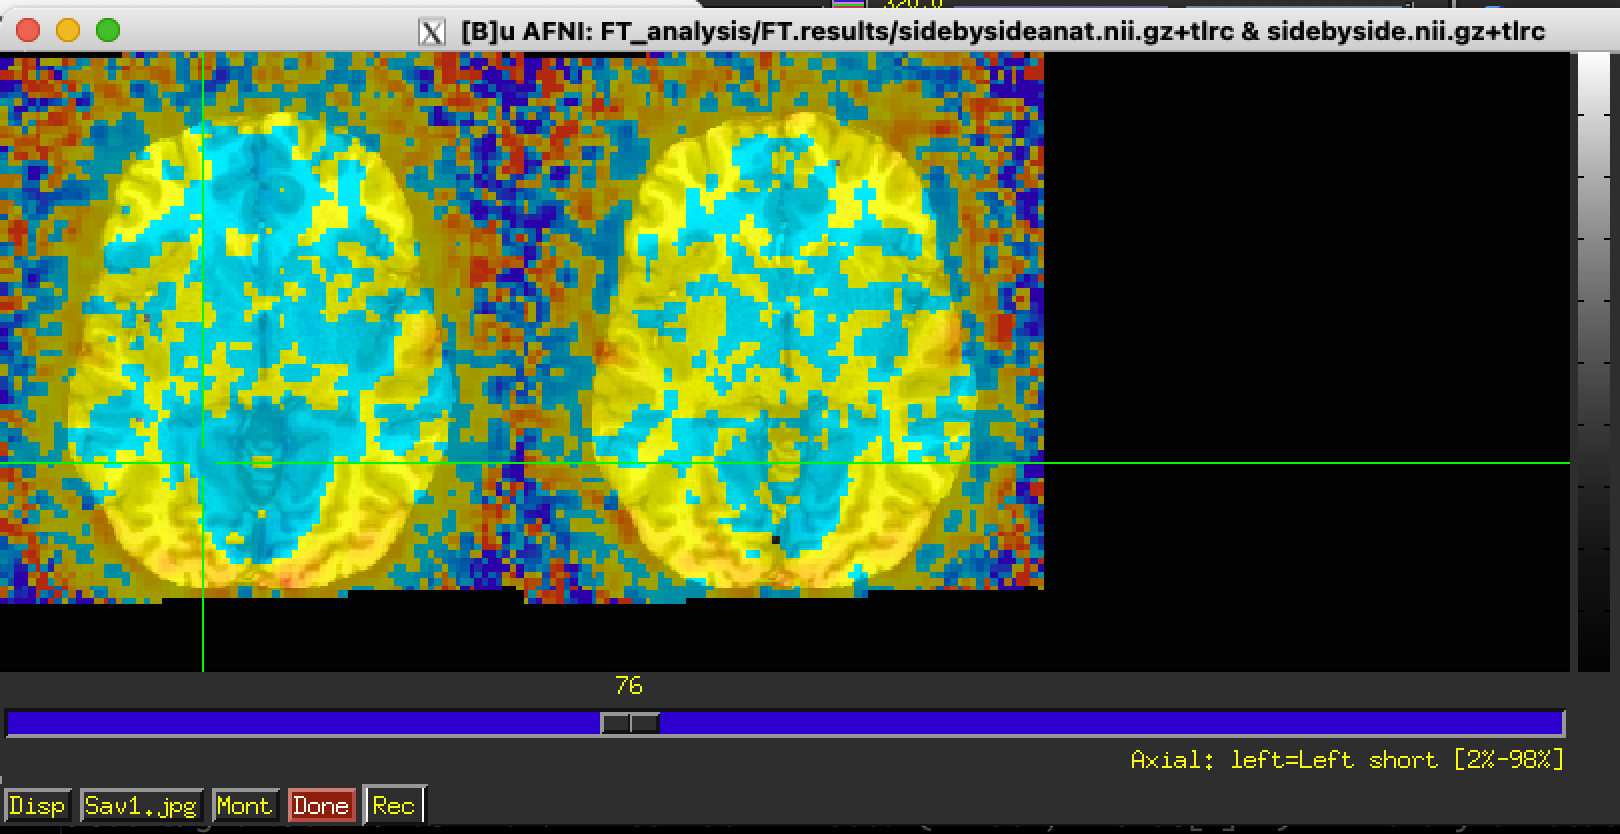
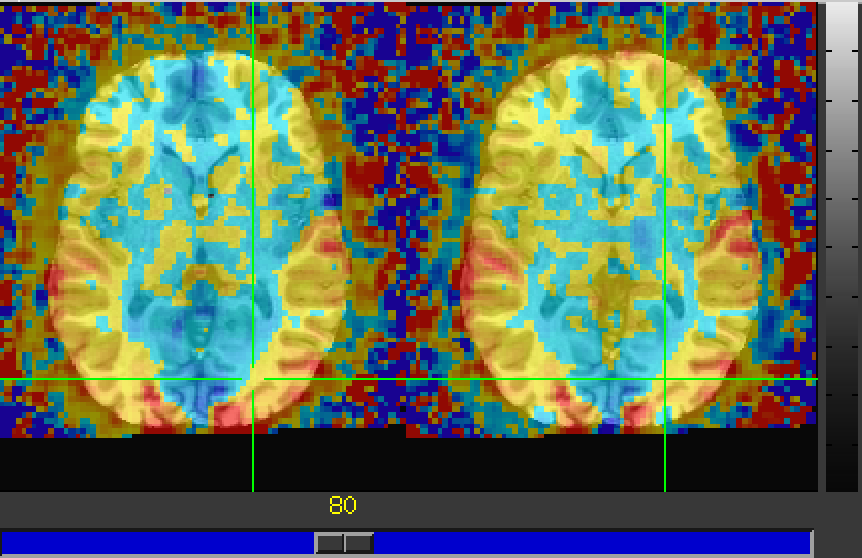
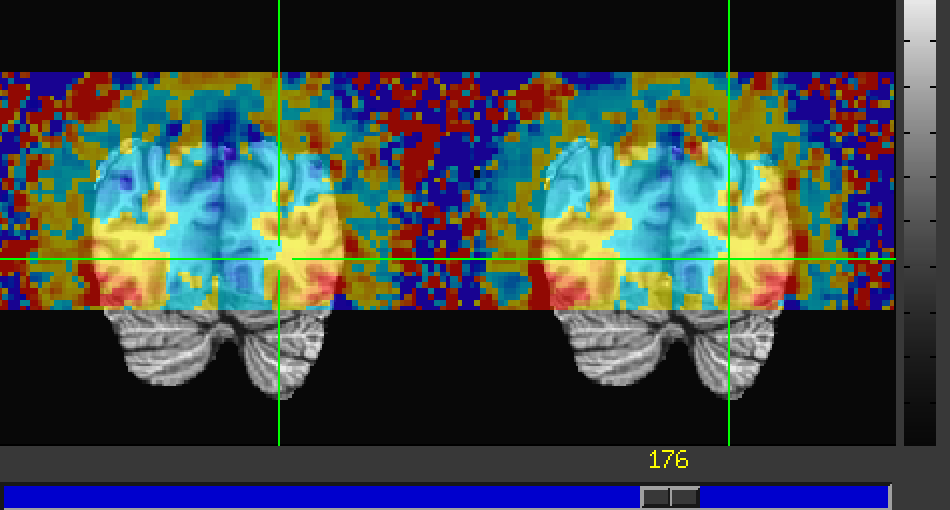
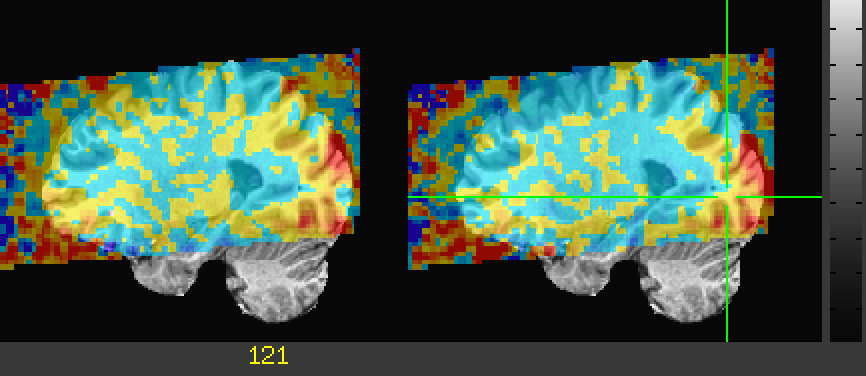
Another way to show two or more datasets side by side is to make the datasets side by side inside one dataset. 3dXYZcat can do that like this:
Thse are stored as LPI order, so the default in 3dXYZcat concatenates these along the x-axis left-to-right. There seems to be a bug that adds an extra grids worth of empty voxels, but it still looks useful.
If you want to see single volume results in very quick succession, you could then catenate these across time/volume index with another 3dTcat or 3dbucket and then watch many side by side datasets go by with the graph menu and the 'v' key to go to video mode.
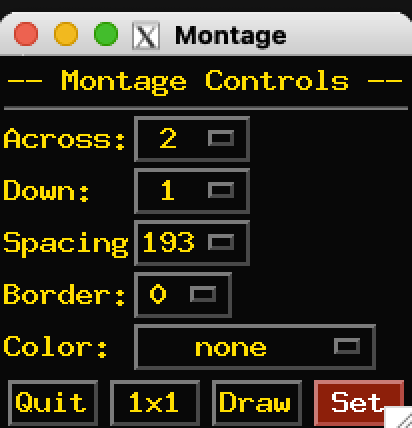
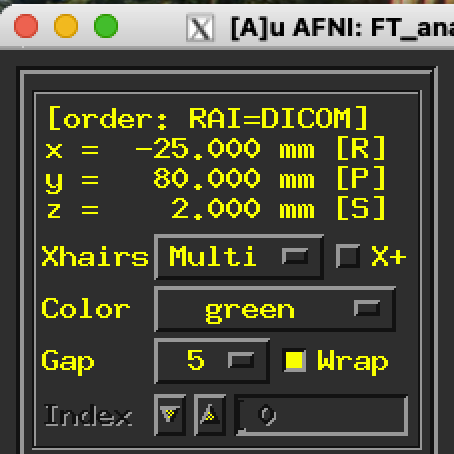
Note, the image has two sets of crosshairs. That's a trick. If you montage the sagittal images with two slices and spacing at the number of sagittal slices in the original volumes, then you get vertical lines for each of the two sagittal slices. For this to work nicely, you should have "multi" selected for crosshairs in the upper left of the AFNI GUI (the default) and the "wrap" box checked there too. The coronal images are also paired by default with the "catted" volume. You have to be a bit careful about selection on the sagittal image though; you can click on either the left or right axial or coronal image, and the sagittal image will show the selected image on the right side, so the left volume could be shown on the right side of just the sagittal view. The wrap-around leads to this seeming anomaly but gives the double crosshair advantage. Selecting either of the sagittal image slices still updates the axial and coronal images.
cool, thanks Daniel! i'll install the next build and give it a whirl
The
National Institute of Mental Health (NIMH) is part of the National Institutes of
Health (NIH), a component of the U.S. Department of Health and Human
Services.