I have a question about RBA. I have a longitudinal data about ROIs correlations before and after some treatment. To simplify the model, I just used the difference of z between the two time points as the Y variable. The only categorial variable is 'group' including exp and sham. This is my script:
Can I draw the conclusion that this treatment has delays the negative trend of difference of z in this ROI?
A statistical model built on experimental data may not lead the investigator to a definitive conclusion. However, in this specific case, you can assert that the analysis, as reflected in the posterior distributions, offers statistical evidence to some degree for the delaying effect at this ROI in the treatment group compared to the controls.
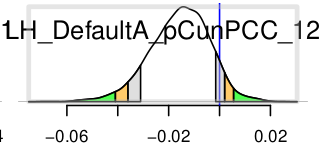
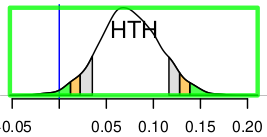
I used 3dNetcorr to produce the original netcc first. Then I combined all correlation values based on HN as the input to RBA and got this distribution (exp_vs_sham) in HTH:
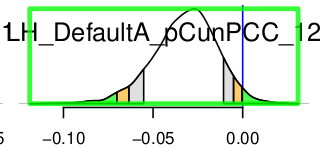
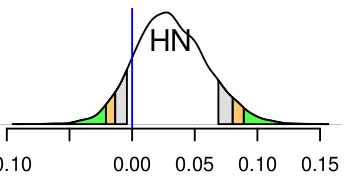
And I also combined all correlation values based on HTH and got a new distribution in HN:
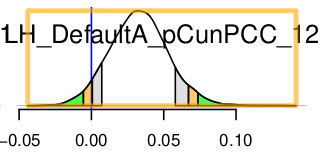
They shows different effect stength but they indeed describe just the same relationship. I know they are based on different subdatasets ... so I want to know how the composition and the size of the dataset can affect the reliability of this statistical model.
Could you provide more details about the input files required for each type of analysis with RBA? Additionally, when you mention "combining" correlations associated with a region, could you elaborate on the specific methodology or process involved? More information would help in better understanding the situation.
Sorry for my awful english expression.
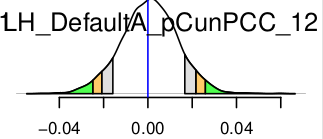
The two sets all came from the same result of one 3dNetcorr running. In the first situation, I extracted all the values related to HN as the input to RBA and got the all distributions. The first figure is the one in HTH. In the second situation, I extracted all the values related to HTH as the input to RBA and the 2nd figure is the final distribution in HN.
The output generated by 3dNetcorr consists of inter-regional correlation values. When you utilize the correlations associated with a specific region as input for RBA, does it imply that you are supplying n-1 correlations per individual, given that you have n regions? The output from RBA would pertain to each pair of these regions. Could you elaborate on how you derived estimates at the region level?
Yes. I have 275 regions totally. At first, I just wanted to focus on the HTH. So I extracted 274 values related to HTH per individual as the input (including HN-HTH). The table and script in the first post is what I used for HTH. In HN, the whole process is as same as in HTH.
No. I have forgot to tell you an important information. That is after getting the 3dNetcorr results, I used the fat_mvm_prep.py to get a table like this:
Subj group stage ROI matrPar Ausgang_val  \
sub-05 exp before Ca__EXA CC 0.2852   \
sub-05 exp before Ca__GPe CC 0.0116   \
sub-05 exp before Ca__GPi CC -0.0319   \
sub-05 exp before Ca__HN CC 0.0447   \
sub-05 exp before Ca__HTH CC 0.0282   \
sub-05 exp before Ca__MN CC 0.1992   \
Then I used python to extract the values of interest and transform them to the final table.
I presume there are 274 labels such as "HTH_***" under the -ROI1 column in your data table. In such a scenario, RBA should provide 274 separate estimates for each effect of interest. However, it seems you got only one estimate labeled as "HTH"? Could you clarify the reason for this discrepancy?
In that case, why weren't the plots labeled as 'HN_HTH' and 'HTH_HN' by RBA?
Regarding the discrepancy in effect assessments between the two analyses, the underlying reason lies in the modeling strategy employed by RBA, which is centered on information sharing and pooling. Essentially, each region pair is not evaluated alone, but estimated relative to the whole set of region pairs, as elucidated in this paper. Given the differing composition of region pairs in your two analyses, the same region pair 'HN_HTH' (or 'HTH_HN') is assessed in distinct ways.
I am not well familiar with python. So I chose the simplest but a little stupid way to extract the data.
I have read your paper before doing this analysis. But this result seems to tell us that in a certain degree, the statistical significance can be made up. So my question is: how do you overcome this shortcoming in your daily practice?
Statistical evidence is inherently relative, influenced by various factors such as sample sizes and the framing of data. To illustrate the nuanced distinction between the two analyses you highlighted in your case, consider the following analogy: Assessing a student's academic performance within his school setting involves comparing him with two groups of peer students—those who were born in the same birth month as him and those who share the same body height, with a tolerance of \pm 2 cm. Put differently, the degree of arbitrariness in the statistical evidence within your case is influenced by your selection of the specific data to concentrate on.
A more apt framing for scientific inquiry involves the accumulation of knowledge through effect estimation rather than relying on a decision-making process driven solely by a dichotomous threshold. In essence, the focus should be directed towards conveying the magnitude of effect estimation and its associated uncertainty.
Thanks for your kind reply! As I become more familiar with afni, I increasingly agree with your ways to deal with problems in fmri.
The
National Institute of Mental Health (NIMH) is part of the National Institutes of
Health (NIH), a component of the U.S. Department of Health and Human
Services.