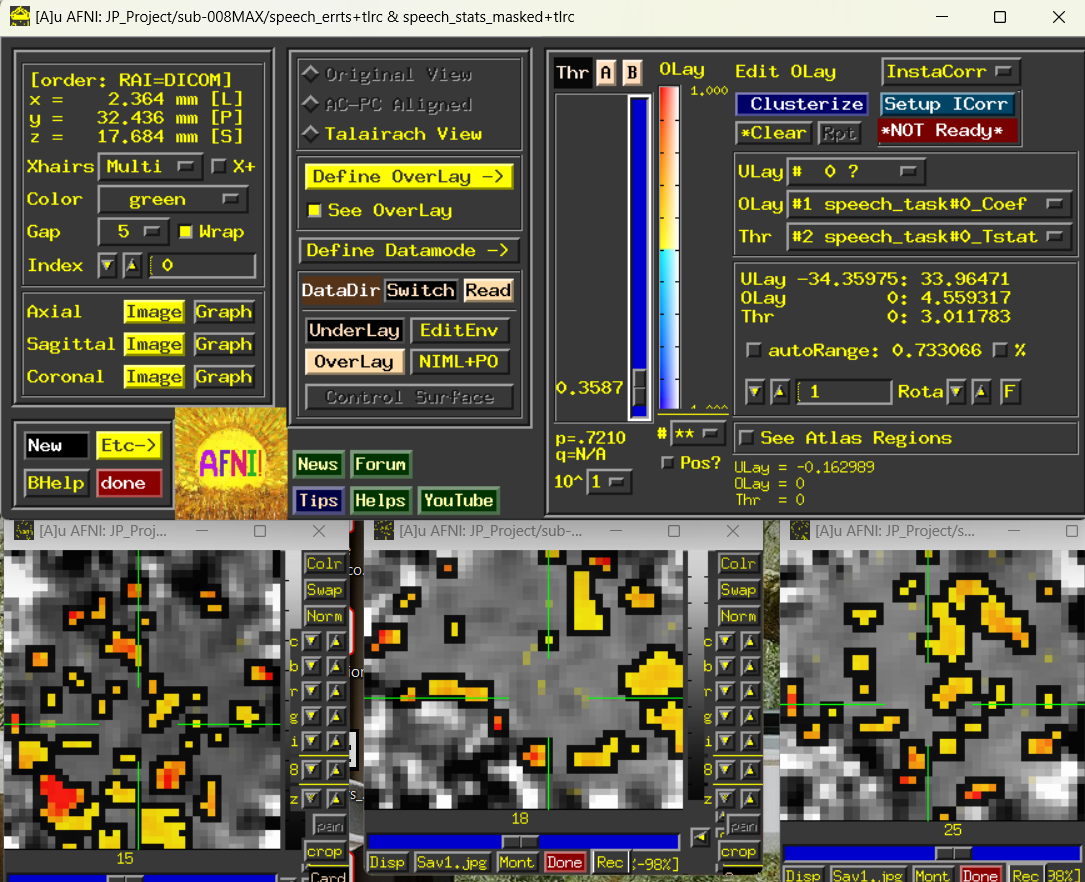
Hello. My GUI image look like the screenshot. I'm using the t1 file for the underlay and the stats file for the overlay. Can you help me troubleshoot why I'm not getting an image more representative of the brain regions? Thanks!
What are the units of your Coef values here, for setting a good min/max colorbar range? That might add some brain-like definition. If the units are just "BOLD % signal change" (i.e., you used afni_proc.py with the "scale" block to process your task FMRI data, and you don't have any amplitude/duration modulation), then you probably want a lower value colorbar range than +/-4.677, which is the autoRange value here (from the distribution of values across the olay volume). If you de-select that and put, say, 2 below it, how does that look? Note that if this Olay volume were a contrast between stimuli, you might expect much lower values globally, too, so you would aim for lower colorbar ranges.
It is not unusual to see large Coef values outside the brain, either. Such is the noisiness of FMRI data. The statistic (or uncertainty) information comes into play with why that is typically not an interpretational worry or necessarily sign of badness.
If you threshold your data (preferably transparently with the Alpha and Boxed functionality on to see keep seeing more information, how do things look? Do you see localized high beta values in areas of interest, which might be speech areas, judging by your Coef labels?
Hello! Thank you for your recommendations! I've been playing around with them. I also appreciated your article; it's very helpful for presenting results! The Appendix talks about the opacity of the underlay, and I think this is the problem for me. Even if I do mask out the non-brain voxels (your paper says not to do this, but just to experiment), I still don't get a good visualization of the T1 underlay. Is there a fix for this?
The underlay there looks like a coarse dataset with no spatial resolution. So, I am guessing it is an EPI dataset, and probably the result of the scaling operation (or the downstream regression one), in which each voxel's mean is set to 100 (and the EPI fluctuations are just in the range of a few percent at most inside the brain, hence it looks quite homogeneously colored). The underlay dataset sets the grid for visualization, hence the chunky outlines still in the overlay. Actually, I can see the labels of the loaded dsets in the top of the GUI, and you have the "errts" file as underlay, so that is the residuals of processing, which have mean=0 specifically.
Can you click the "Underlay" button and select a different underlay dataset---say, the final_anat*HEAD one? That will give you a more detailed grid to display on, and one with anatomical information.
Thanks for your quick reply! I'm starting with a t1 file for the ulay (pic), but when I choose the stats olay, the ulay automatically changes to the "errts" file. The t1 file won't "stay" selected. I don't have a "final_anat*HEAD" file. Thanks for your help and patience!
Your errts file is in standard space (I could see "+tlrc" in the filename), and your t1.nii here is in original space (I see "+orig" in the upper edge of the panel). It isn't really appropriate to underlay the EPI results that are in standard space with the anatomical data in original (unregistered) space.
That is why I suggested underlaying an anatomical that is in standard space, as well, which final_anat* would be. Can you please try that?
--pt
The
National Institute of Mental Health (NIMH) is part of the National Institutes of
Health (NIH), a component of the U.S. Department of Health and Human
Services.