Howdy-
This is a copy of your command with vertical alignment to help make it more digestible:
3dttest++                                                                    \
    -prefix  $results_dir                                                    \
    -mask    $mask_dset                                                      \
    -setA    OddNeg-StandNeg                                                 \
             01 "AFNI_data8500/8500_1.results/stats.8500_1+tlrc[19]"         \
             02 "AFNI_data8334/8334_6.results/stats.8334_6+tlrc[22]"         \
             03 "AFNI_data8345/8345_6.results/stats.8345_6+tlrc[16]"         \
             04 "AFNI_data8396/8396.results/stats.8396+tlrc[25]"             \
             05 "AFNI_data8495/8495.results/stats.8495+tlrc[16]"
I'm surprised to see different subbrick selectors used on most different subject stats files, like "[19]" and "[22]", etc. If the stats dsets were all processed in the same way, then likely that means different effects are being compared with the 1-sample t-test, and I'm not sure that would likely be desirable.
Note that you can also use labels for subbrick selectors, to help specify more clearly what you want to compare. To see all the string labels in a dset, you can use:
3dinfo -label DSET
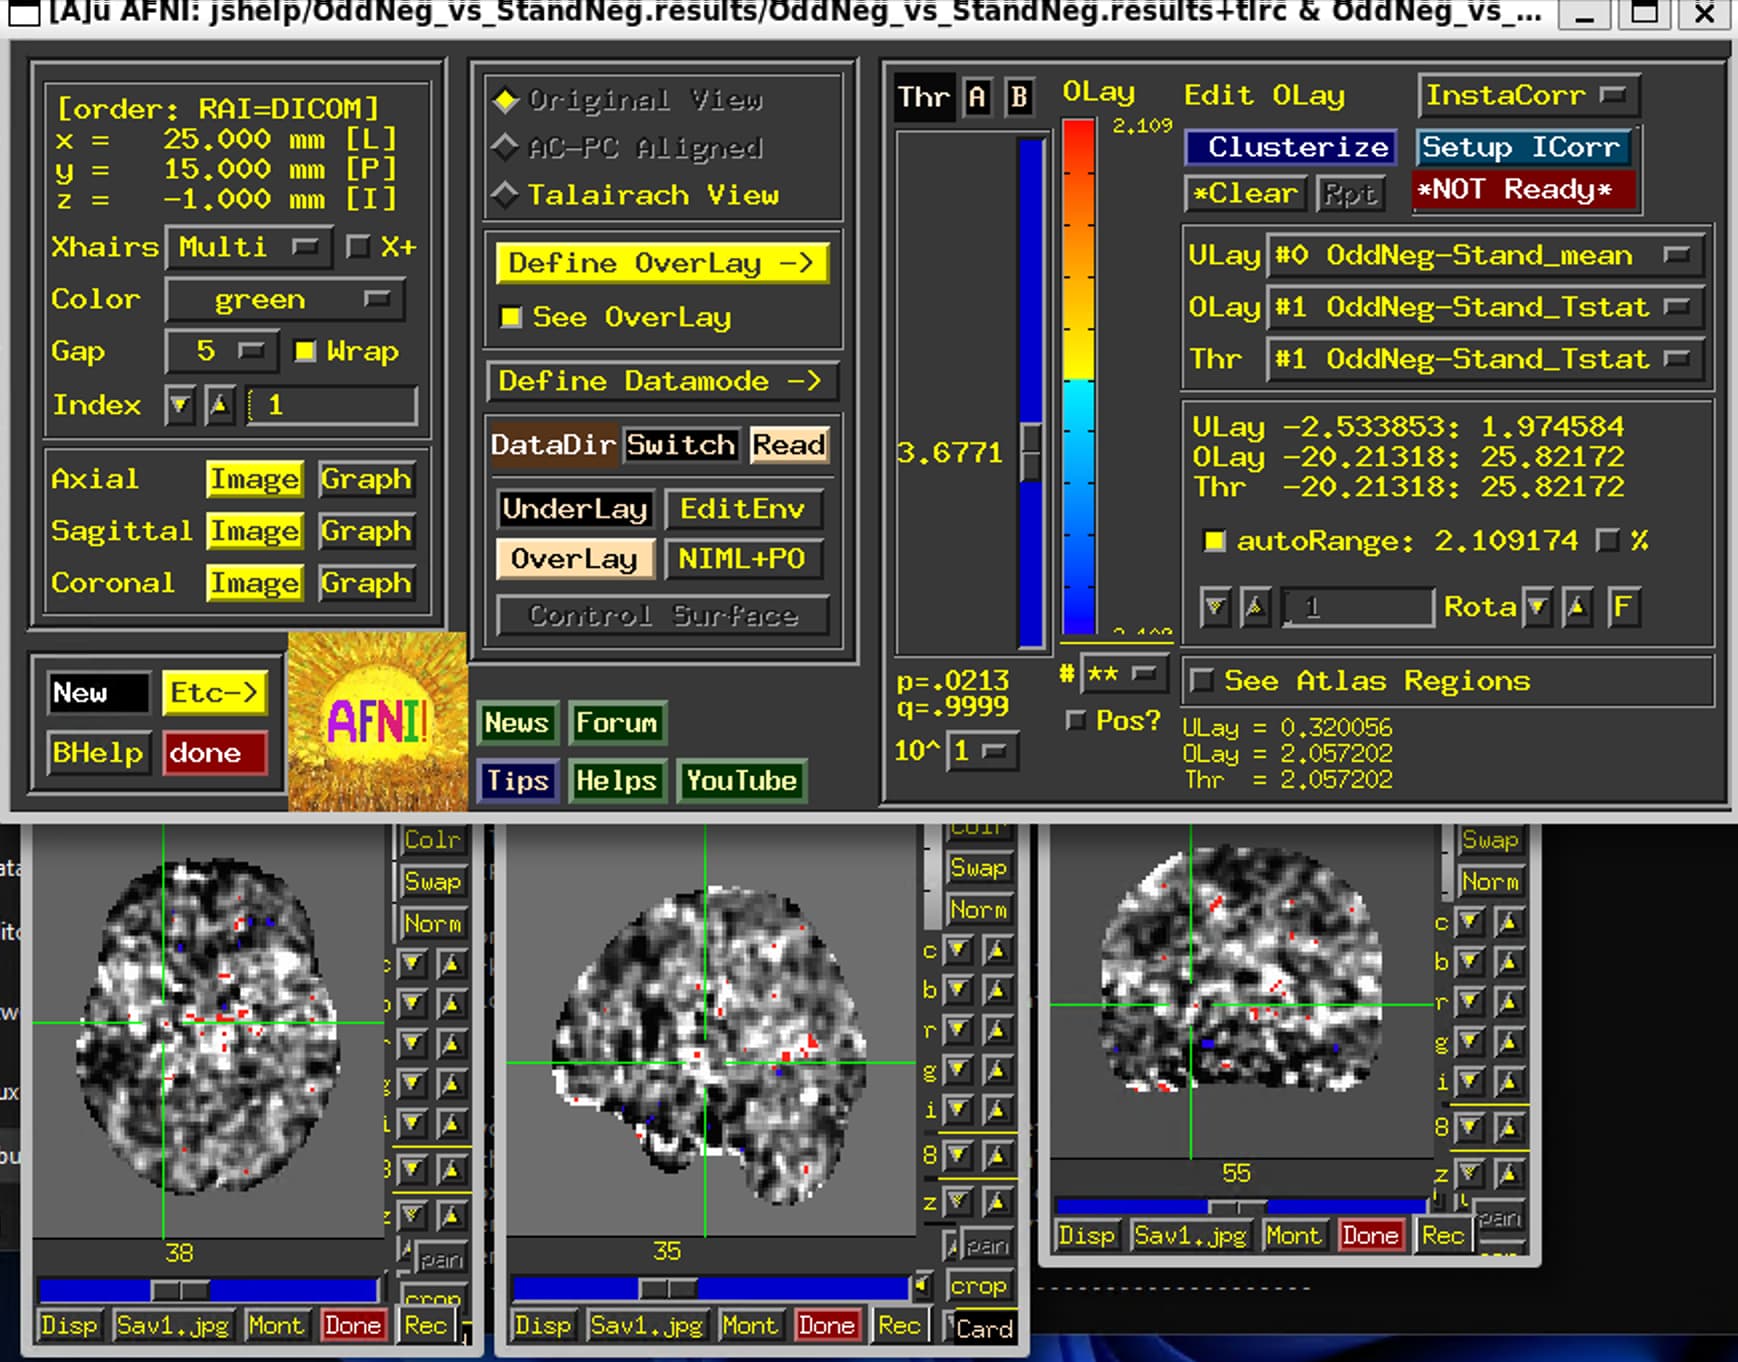
From an earlier thread with your AP command, and from looking at the Olay and Thr volume labels in your GUI snapshot here, let's say you were interested in this GLT contrast from your processing: "OddNeg-StandNeg". Then you could use that Coefficient within square brackets, which I think is likely this: "[OddNeg-StandNeg_GLT#0_Coef]".
Note that when you display the output of statistical testing, it's nice wherever possible to use the effect estimate as the Olay and the stats subbrick as the Thr. More about why this is the case is described here:
- Chen G, Taylor PA, Cox RW (2017). Is the statistic value all we should care about in neuroimaging? Neuroimage. 147:952-959.
Also, rather than applying a mask, it is often illustrative and informative to see modeling results everywhere, and to use transparent thresholding. The reasons for this are described more here:
- Taylor PA, Reynolds RC, Calhoun V, Gonzalez-Castillo J, Handwerker DA, Bandettini PA, Mejia AF, Chen G (2023). Highlight Results, Don’t Hide Them: Enhance interpretation, reduce biases and improve reproducibility. Neuroimage 274:120138.
- Taylor PA, Aggarwal H, Bandettini PA, Barilari M, Bright M, Caballeros-Gaudes C, Calhoun VD, Chakravarty M, Devenyi G, Evans J, Garza-Villarreal E, Rasgado-Toledo J, Gau R, Glen DR, Goebel R, Gonzalez-Castillo J, Gulban OF, Halchenko Y, Handwerker D, Hanayik T, Lauren PD, Leopold D, Lerch J, Mathys C, McCarthy P, McLeod A, Mejia A, Moia S, Nichols TE, Pernet C, Pessoa L, Pfleiderer B, Rajendra JK, Reyes L, Reynolds RC, Roopchansingh V, Rorden C, Russ BE, Sundermann B, Thirion B, Torrisi S, Chen G (2025). Go Figure: Transparency in neuroscience images preserves context and clarifies interpretation. (submitted) arXiv:2504.07824
- And in this AFNI Academy play list on results reporting.
Mechanics for doing this in the GUI are described more here.
Finally, I would probably underlay the relevant template/anatomical dataset, instead of the stats results dataset itself, to help see where things are across the brain.
And note that with only 5 subjects in the 1-sample t-test, results will likely be pretty noisy still, esp. when viewing a contrast.
--pt