Factors in 3dLMEr

[picchionid@cn0002 ~]$ afni -ver
Precompiled binary linux_rocky_8: Oct 31 2024 (Version AFNI_24.3.06 'Elagabalus')
[picchionid@cn0002 ~]$ R --version
R version 4.4.2 (2024-10-31) -- "Pile of Leaves"

Gang,

Hi! How are you? Happy holidays!

I have exciting news. Our sleep manuscript is almost ready for resubmission. Let me please ask you some questions about categorical variables/factors in 3dLMEr for the analyses contained therein. You have already reviewed them as a coauthor, but let me ask some questions anyway. I compared 3dLMEr results using a factor to a separate 3dLMEr using a quantitative variable. Here

3dLMEr \
    -prefix output_lme_comsst_${region}${regsiz}_${prepro}_${statin}.nii \
    -jobs 32 \
    -model "1+SStage+(1+SStage|Subj)" \
    -R2 \
    -SS_type 3 \
    -dataTable \
    Subj        Cond    AAT     SStage  InputFile \
s00003  aro1    70      n3      20160713_2255_hip_procbasic_rz.nii.nii
s00003  aro2    25      n2      20160713_2326_hip_procbasic_rz.nii.nii
s00003  aro3    35      n2      20160714_0004_hip_procbasic_rz.nii.nii
...
s00105  aro5    0       r       20170413_0535_hip_procbasic_rz.nii.nii

is the code for the factor, and here

3dLMEr \
     -prefix output_lme_audaro_${region}${regsiz}_${prepro}_${statin}_nocondinmodel.nii \
     -jobs 32 \
     -model "1+AAT+(1+AAT|Subj)" \
     -qVars 'AAT' \
     -R2 \
     -SS_type 3 \
     -gltCode AATeff 'AAT : ' \
     -dataTable \
      Subj    Cond    AAT     SStage  InputFile \
s00003  aro1    70      n3      20160713_2255_hip_procbasic_rz.nii.nii
s00003  aro2    25      n2      20160713_2326_hip_procbasic_rz.nii.nii
s00003  aro3    35      n2      20160714_0004_hip_procbasic_rz.nii.nii
...
s00105  aro5    0       r       20170413_0535_hip_procbasic_rz.nii.nii

is the code for the quantitative variable. Everything works great. My questions are about comparing these two results.

I was careful to make the comparison fair. Both use identical input data. In both cases, I compared the Chi-sq sub-brick (#0). However, I have a nagging concern about a small potential difference in the sensitivity/statistical power (1 - beta) of these two analyses. How did you program AFNI/R to calculate the resulting singular chi-square for the factor of sleep stage (SStage)? In my multiple regression experience, factors must be transformed into k-1 dummy-coded variables before being entered into the model, and you get k-1 statistical tests for those levels versus the chosen reference level. If you want to know the variance explained by the original factor as a whole, you need to use R^2 and the associated F for the whole model, including all the dummy-coded variables. Is the dummy coding done in a way that is transparent to the user? Do I understand correctly that the resulting singular chi-square from the above code can be interpreted as analogous to a main effect or a model R^2 with the associated F? If yes, how is that done? If no, what does it represent, and how was it calculated?

Because the analysis with one quantitative variable is being compared to an analysis with four dummy-coded variables (5 sleep stages - 1), does the analysis with one quantitative variable have an unfair advantage because it has greater statistical power derived from fewer variables in the model? If yes, could I make the comparison fair by decreasing the alpha in the analysis with one quantitative variable?

I read the 3dLMEr help file with the following text but would still appreciate your input. "Main effects, interactions and the composite effects (automatically generated by 3dLMEr) are represented in the output as chi-square with 2 degrees of freedom. The fixed number of DFs (i.e., 2) for the chi-square statistic, regardless of the specific situation, is adopted for convenience because of the varying DFs due to the Satterthwaite approximation" (AFNI program: 3dLMEr).

Sincerely,

Dante
Dante,

Great to hear your manuscript is nearing resubmission—best of luck with the reviews!

Is the dummy coding done in a way that is transparent to the user? Do I understand correctly that the resulting singular chi-square from the above code can be interpreted as analogous to a main effect or a model R^2 with the associated F? If yes, how is that done? If no, what does it represent, and how was it calculated?

Regarding this question, the specific dummy coding method used in a model typically does not affect the results. For convenience and consistency, AFNI programs default to effect coding for population-level analyses. You can explore various coding methods in this resource.

On degrees of freedom, the concept in conventional statistics applies primarily to simpler models, such as regression or general linear models, without hierarchical complexity. In hierarchical models, degrees of freedom are not straightforward to define. For this reason, tools like 3dLMEr approximate degrees of freedom and convert the results into a \chi^2-statistic with two degrees of freedom for convenient bookkeeping. This approximation serves a purpose similar to that of an F-statistic in traditional omnibus tests.

Because the analysis with one quantitative variable is being compared to an analysis with four dummy-coded variables (5 sleep stages - 1), does the analysis with one quantitative variable have an unfair advantage because it has greater statistical power derived from fewer variables in the model? If yes, could I make the comparison fair by decreasing the alpha in the analysis with one quantitative variable?

The differences between the two models you implemented are not about statistical power (or decision-making with statistics in the conventional sense) but rather about their underlying assumptions and interpretations:

  • Quantitative variable assumption: When "sleeping stage" is treated as a quantitative variable, the model assumes that differences between consecutive stages are uniform in magnitude and direction (e.g., linear increase or decrease).

  • Categorical variable assumption: When "sleeping stage" is modeled as a categorical variable, no assumption is made about uniformity or directionality between consecutive stages. With a much weaker assumption, this allows for more flexibility in capturing subtle, non-linear or non-uniform relationships.

I hope this clears up any confusion about the assumptions and interpretations of these models.

Gang Chen

1 Like

Gang,

Please let me be more direct. Could the differences in the results we see between the two analyses be due to differences in the degrees of freedom in the model variables?

Sincerely,

Dante

P.S.: The two analyses contain two different variables; the categorical variable was not obtained merely by taking the quantitative variable and categorizing it.

Dante,

The two analyses contain two different variables; the categorical variable was not obtained merely by taking the quantitative variable and categorizing it.

What is the relationship between the two variables? The differences in statistical evidence between the two models are likely more than just variations in degrees of freedom. Instead, these differences are primarily driven by the intrinsic nature of the variables and the distinct assumptions underlying each model.

Gang Chen

1 Like

Gang,

Hi again. Thanks for your patience.

SStage is the five conventional sleep stages:
stage wakefulness (W),
stage nonrapid eye movement 1 sleep (N1),
stage nonrapid eye movement 2 sleep (N2),
stage nonrapid eye movement 3 sleep (N3), and
stage rapid eye movement sleep (R).

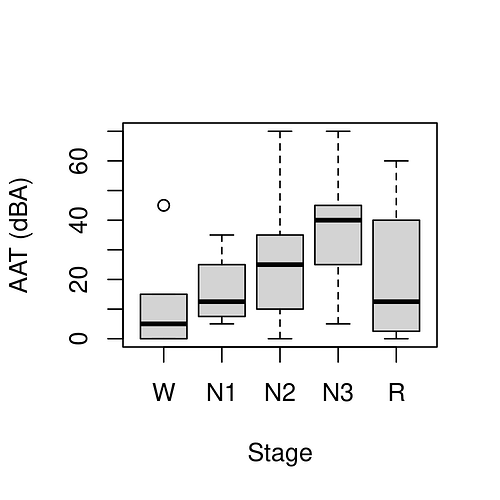
AAT is auditory arousal threshold. This is the intensity of a tone (dBA) that was necessary to produce an unambiguous verbal response. It is a behavioral measure of sleep depth and is mostly independent of the conventional sleep stages. It is correlated with them, but there is much variability of AAT across the stages and within any particular stage. See the attached figure.

Sincerely,

Dante

Attachments:
output_aat_box.png

Hi Dante,

The additional information about the two explanatory variables, SStage and AAT helps me understand more about the background. Although I lack extensive knowledge in sleep studies, I can assume the following causal relationships involving these variables and the response variable Y: SStage \rightarrow Y, and AAT \rightarrow Y.

It's not entirely clear which causal direction is more valid between SStage \rightarrow AAT and AAT \rightarrow SStage. Regardless, your two models seem designed to address separate questions: one model examines SStage \rightarrow Y, while the other focuses on AAT \rightarrow Y.

Even though there is some correlation between SStage and AAT, they remain distinct variables. Therefore, the statistical evidence for the two models is expected to differ to some extent, beyond just the superficial differences in degrees of freedom.

Gang Chen

1 Like

Thanks again. I will think about this.