AFNI version info (afni -ver): Precompiled binary macos_13_ARM_clang: Jan 12 2025 (Version AFNI_24.3.10 'Elagabalus')
Hi everyone,
I’ve run experiments with two subjects and am preprocessing the data using AFNI. I first performed sswarper2, then ran afni_proc.py using the outputs from sswarper2.
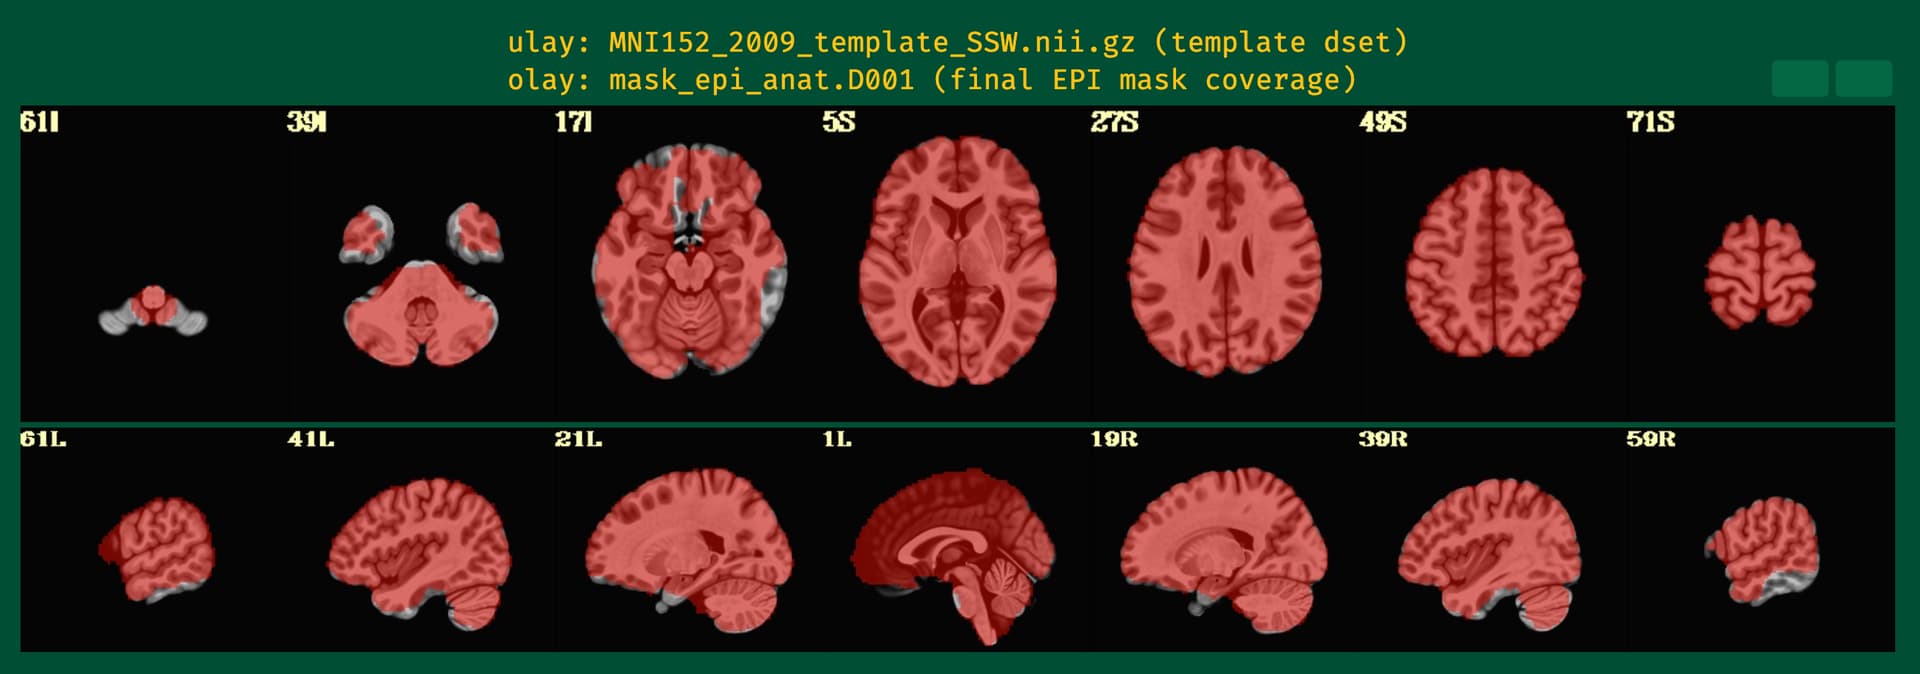
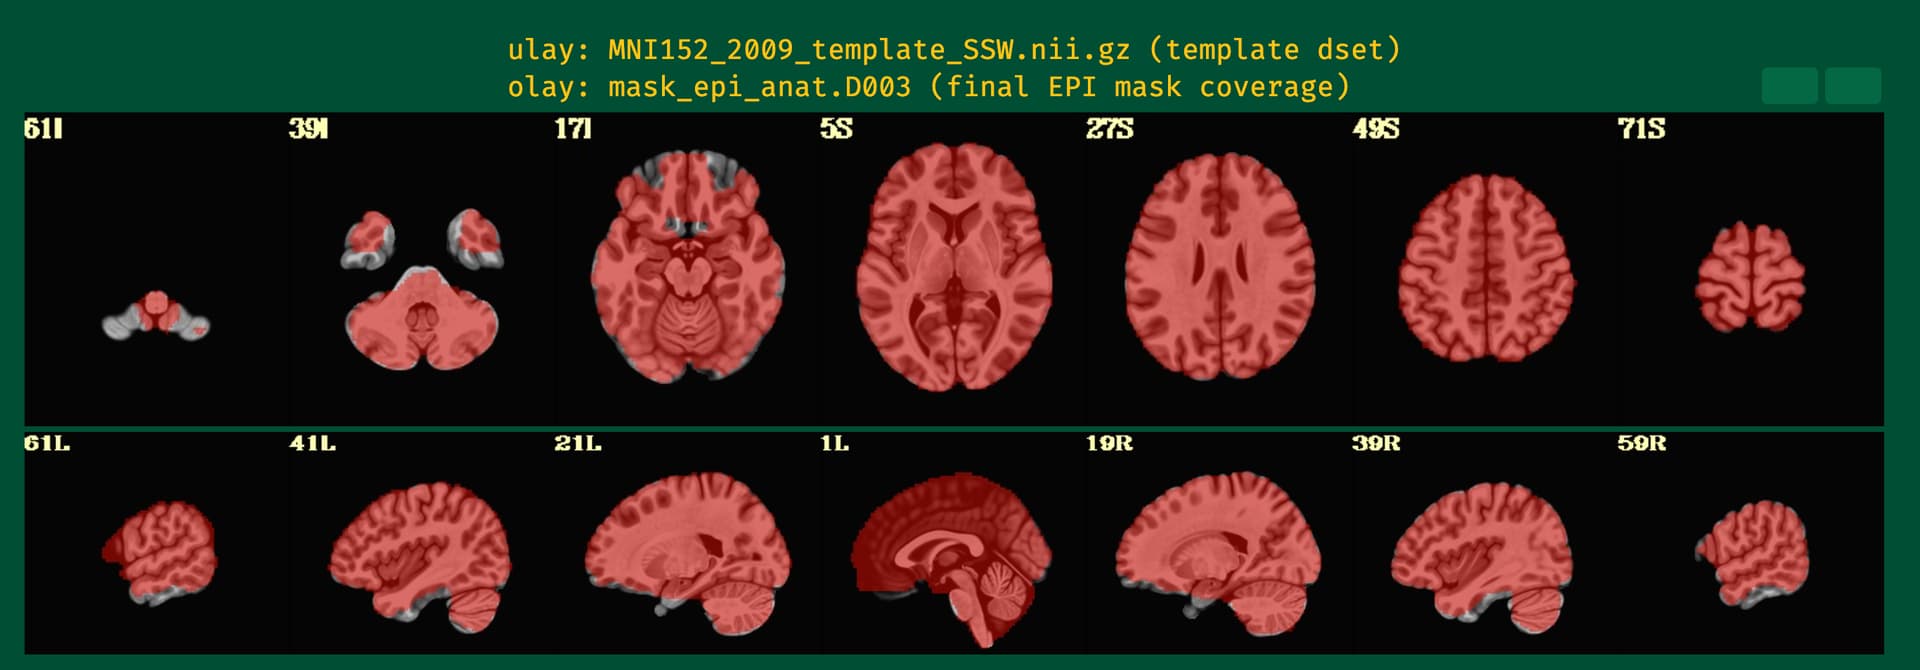
In the QC output, I noticed that the EPI mask does not align well with the MNI template, especially in the ventral stream (please see 59R of the attached images), which is the main region of interest for my study. Unfortunately, both subjects show poor coverage in this region.
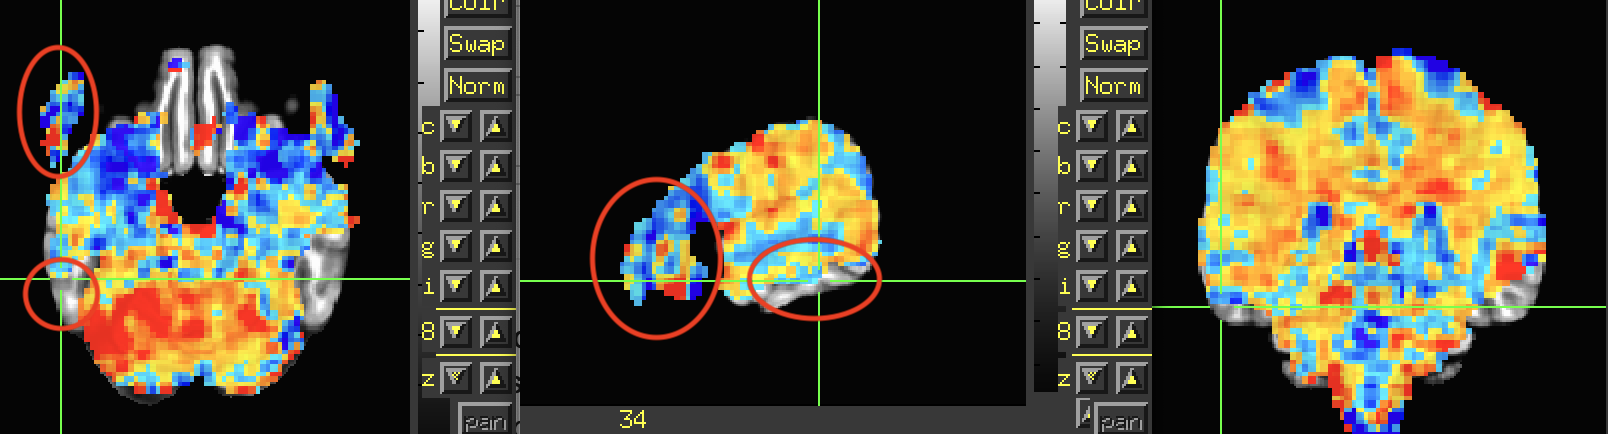
Additionally, I observed statistical results outside of the brain, which is concerning.
Do you have any suggestions for improving alignment?
Thanks for your help in advance.
sswarper2:
time sswarper2  \
        -base   /Users/andy/abin/MNI152_2009_template_SSW.nii.gz        \
        -subid  ${subj}         \
        -input  ${dir_raw}/T1.${subj}.nii       \
        -odir   ${dir_out}
afni_proc.py:
afni_proc.py \
        -subj_id ${subj} \
        -script proc_${subj} \
        -out_dir ${dir_preproc} \
        -blocks despike tshift align tlrc volreg blur mask scale regress \
        -copy_anat ${dir_ssw}/anatSS.${subj}.nii \
        -anat_has_skull no \
        -anat_uniform_method unifize \
        -anat_unif_GM yes \
        -dsets ${dir_raw}/func.${subj}.r0?.nii  \
        -radial_correlate_blocks tcat volreg \
        -blip_reverse_dset ${dir_raw}/dist_PA.${subj}.nii \
        -tlrc_base MNI152_2009_template_SSW.nii.gz \
        -tlrc_NL_warp   \
        -tlrc_NL_warped_dsets ${dir_ssw}/anatQQ.${subj}.nii ${dir_ssw}/anatQQ.${subj}.aff12.1D ${dir_ssw}/anatQQ.${subj}_WARP.nii       \
        -align_opts_aea \
        -cost lpc+ZZ    \
        -ginormous_move \
        -deoblique on   \
        -check_flip     \
        -volreg_align_to MIN_OUTLIER    \
        -volreg_align_e2a \
        -volreg_tlrc_warp \
        -blur_size 4.0 \
        -mask_epi_anat yes \
        -regress_motion_per_run \
        -regress_censor_motion 0.3 \
        -regress_censor_outliers 0.05 \
        -regress_apply_mot_types demean deriv \
        -regress_est_blur_epits \
        -regress_est_blur_errts \
        -html_review_style pythonic \
        -execute
3dDeconvolve:
3dDeconvolve \
        -input ${dir_preproc}/pb06.${subj}.r0?.scale+tlrc.HEAD \
        -censor ${dir_preproc}/motion_${subj}_censor.1D \
        -mask ${dir_preproc}/full_mask.${subj}+tlrc.HEAD \
        -ortvec ${dir_preproc}/motion_demean.1D 'motion_demean' \
        -polort A \
        -float \
        -allzero_OK \
        -num_stimts 5 \
        -stim_times 1 ${dir_behav}/large_${subj}.1D 'GAM' -stim_label 1 large \
        -stim_times 2 ${dir_behav}/medium_${subj}.1D 'GAM' -stim_label 2 medium \
        -stim_times 3 ${dir_behav}/small_${subj}.1D 'GAM' -stim_label 3 small \
        -stim_times 4 ${dir_behav}/nonword_${subj}.1D 'GAM' -stim_label 4 nonword \
        -stim_times 5 ${dir_behav}/null_${subj}.1D 'GAM' -stim_label 5 null \
        -gltsym 'SYM: +large -nonword' -glt_label 1 largeVSnonword \
        -gltsym 'SYM: +medium -nonword' -glt_label 2 mediumVSnonword \
        -gltsym 'SYM: +small -nonword' -glt_label 3 smallVSnonword \
        -fout -tout \
        -x1D X.xmat.${subj}.1D \
        -xjpeg S.${subj}.jpg \
        -bucket stats.size3.${subj}
Howdy-
I think the interepretation of the mask is that it does fit well, but that there is little-to-no signal in those missing regions.
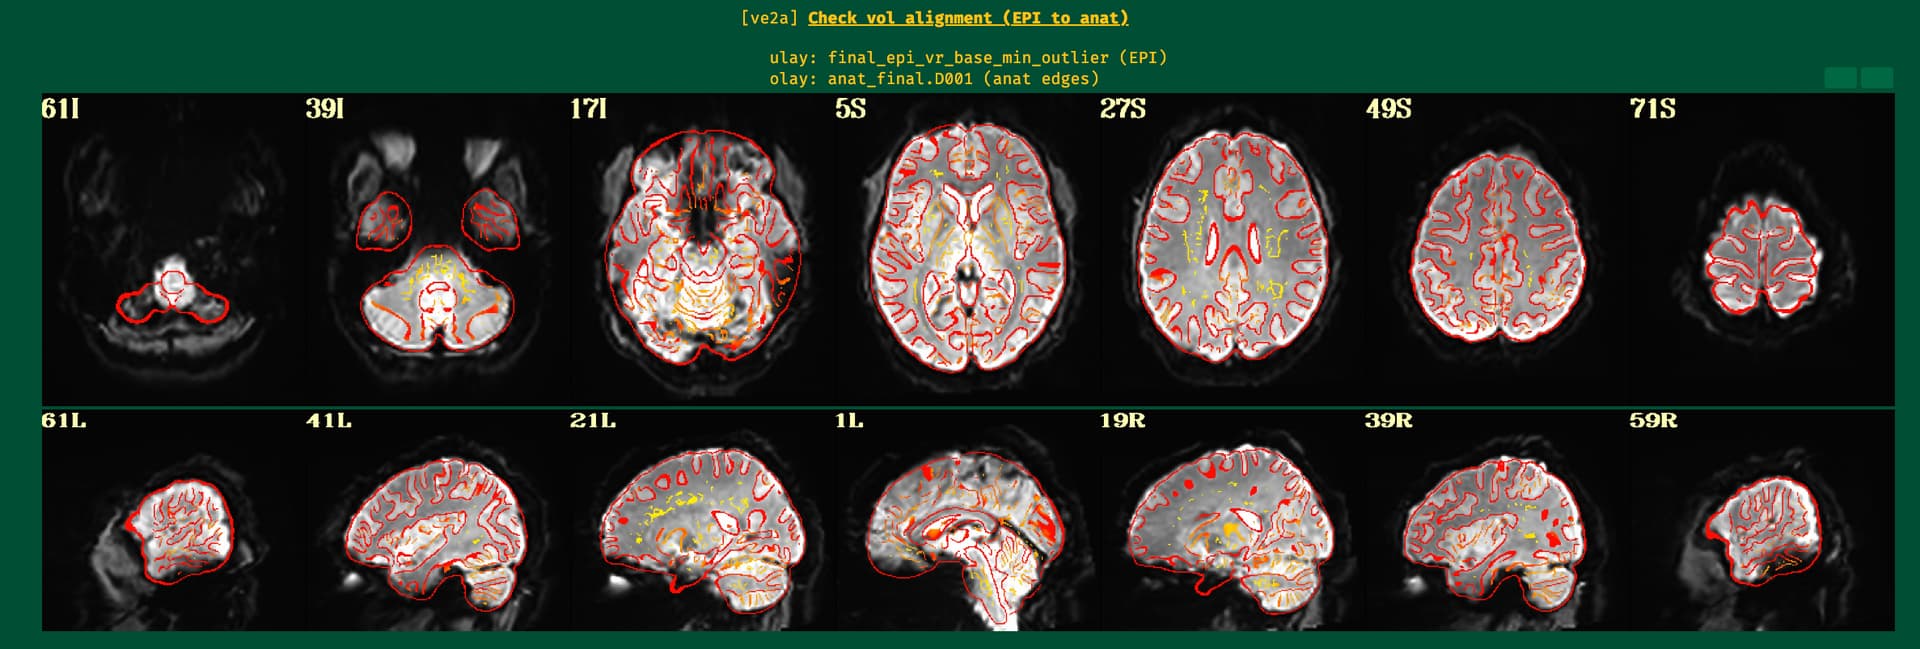
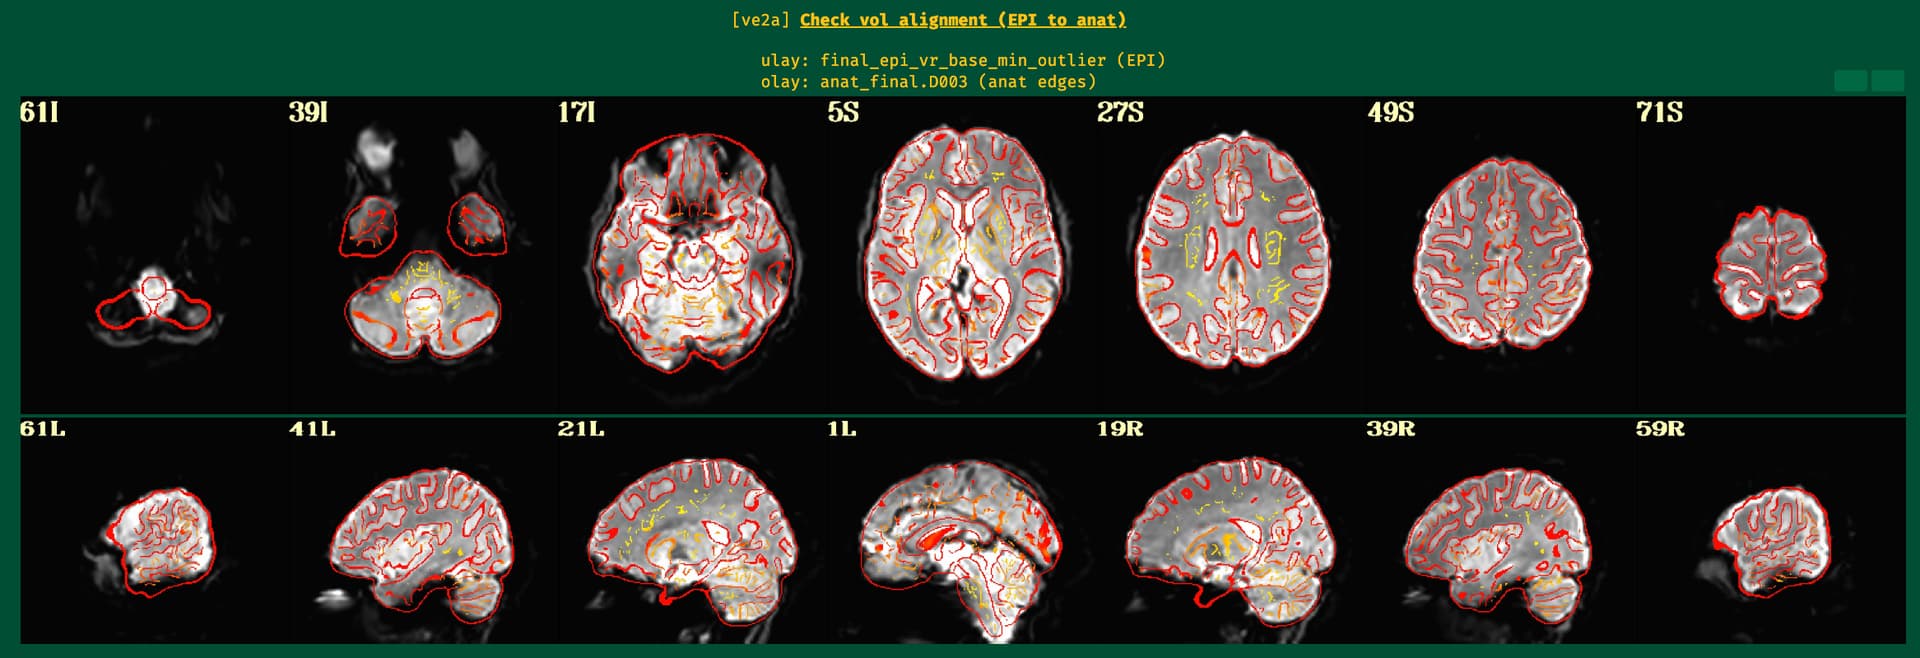
Can you show the ve2a image from the APQC HTML? That will show anatomical edge outlines overlaid on the EPI dset. That will likely help clarify whether there is just low signal strength in those regions. The TSNR maps show similar information, too.
In your third image, I am surprised to seet he stats info masked. Why is that? We typically just estimate a brainmask in afni_proc.py, but don't apply it, so we can see results everywhere. Is that image made separately, and with the mask applied?
--pt
Here are the ve2a images.
The third image shows the GLM output from 3dDeconvolve, apologies for not mentioning that earlier. It represents the beta coefficients for one of contrasts with no threshold (-gltsym 'SYM: +large -nonword' -glt_label 1 largeVSnonword). I applied an anatomical mask of the ventral stream region and extracted the beta values from the region, but many of them were zeros.
Great, thanks for showing those images.
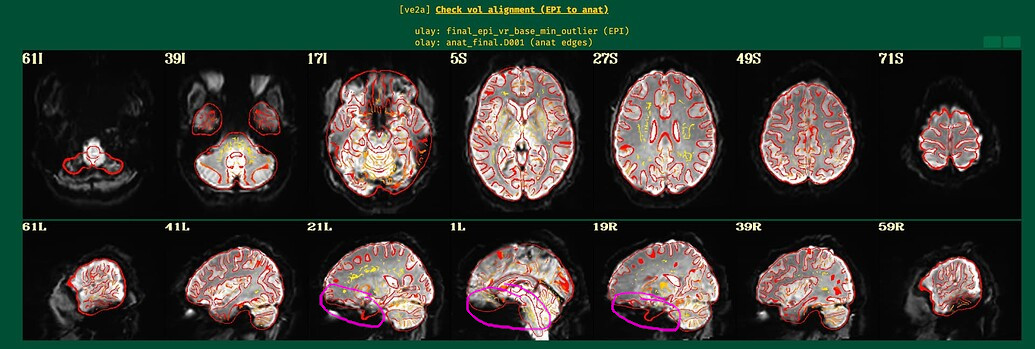
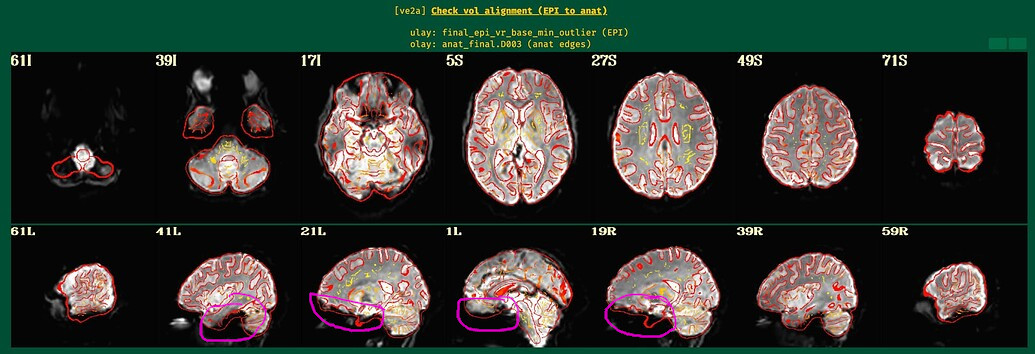
Indeed, EPI-anatomical alignment looks quite successful to me. When we look at some regions of the brain, we can notice that even thought the overlay outlines suggest structures are present in the anatomical image, the underlay EPI is very dark there. This is EPI dropout, which is quite, quite, quite common in FMRI (pesky sinuses that humans have...). See the magenta circles here, which I have drawn in those same images:
In the temporal lobes, subcortex and ventromedial PFC, it is very hard to have signal without a lot of work on most sequences. See Fig. 4 and the section " 2.3.2 ve2a: Alignment of subject EPI to subject anatomical"
in this paper on the APQC HTML.
The dropout in the EPI here corresponds to the non-mask regions you were highlighting in your original post.
--pt
Thank you! After looking at your paper, I now realize this is a very common issue. It’s reassuring to know that it’s not something I did wrong. But unfortunately I am interested in the ventral stream of the visual system.
I have a couple of follow-up questions.
- Is there any way to restore or recover signal in dropout regions? Could you point me to any references? Does the paper discuss techniques for mitigating EPI dropout?
- Since this seems to be a widespread issue, do most researchers simply exclude or ignore signal from areas like the ventromedial prefrontal cortex and subcortex? In my case, I am extracting beta values from the ventral stream region (to run RSA), but I'm unsure if I can simply exclude the zero beta values in the region. Would that be considered standard practice, or is there a better way to handle this?
I think this is a long-running historical problem. I have almost never seen a dataset that doesn't have significant dropout in these regions, so I am not sure how people have studied these regions in detail. I guess many people have not checked, in many cases. The QC HTML tries to help people understand their data in detail---sometimes, in gory detail---to know what boundaries may be appropriate for their analyses. Or, hopefully if folks are acquiring their own data, then helping them check during the piloting phase to feedback to any paradigm or acquisition adjustments.
Unfortunately, once the data have been acquired with dropout, I don't know of a way to recover signal. There have to be tricks/strategies employed at the time of scanning. Using multi-echo FMRI can help boost SNR to some extent, but probably not fully for this. I believe tilting the head or field of view angle to minimize the number of slices that pass through the sinuses can help a bit. But I don't know of a successful scanner strategy in detail to get signal in those regions.
--pt
Thanks for your answer. I sincerely appreciate it.
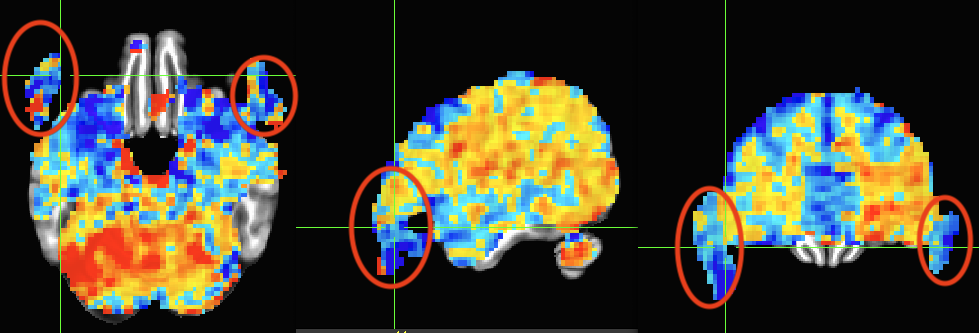
One last question. How should I interpret stats that appear outside the brain? Since the EPI-to-anatomical alignment looks good, can I assume those values are just noise and safely ignore them? The below image is the same data as shown in the third image in my original post and shows beta coefficients without threshold.
You have data everywhere throughout your acquired field of view---even in the air outside the brain, even in the dropout regions, even in the eyeballs of the participant, etc. Some of it will be noisier and more distorted than others, and some in regions you don't care about (hopefully some in regions you do care about, too!).
I would not mask the data and view all the results across the whole FOV. I would select the overlay volume as the stimulus or GLT betas you care about (which you are already doing!), since you have scaled the data and then choose the stats volume for thresholding, and then apply a transparent threshold by clicking the "A" and "B" buttons above the colorbar in the GUI. Now, you can see results everywhere in a meaningful-yet-focused way. This is the way the APQC HTML stats volumes in the "vstat" section will be presented, to help you check everything. Looking without a threshold is fine, too.
Individual subject data will be noisy. Alignment to a template space won't be perfect for every sulcus+gyrus (but hopefully it looks overall pretty good!). Draining veins and magnetic field effects can make meaningful-looking betas appear in odd places. That can be OK, as long as their aren't very weird or extreme patterns. Some brain masking won't be perfect either, but to be sure, are those temporal lobes or anything (from looking at the red mask region above in the first post, it doesn't look like a lot from that mask overhangs outside the data?)? Oh, I wonder if you are applying a different mask (full_mask.${subj}+tlrc.HEAD) than what we would recommend as the "subject final" mask, namely mask_epi_anat*HEAD, which is what is shown in in the first images (the filename is written above the images). But again, I would not apply the mask to my 3dDeconvolve mask---see everywhere to know what is happening everywhere, to the fullest extent.
--pt
Ah, I see now. Thank you so much for the detailed explanation, Dr. Taylor. Truly appreciate your guidance!