New program: colorbar_tool.py (ver: AFNI_25.0.03)
This program is for working with AFNI-style colorbar (cbar) and
palette bar (pbar) files. It might also be fairly general-purpose for
PNG, JPG and other rasterized colorbar files, as long as they have a
pretty straightforward formatting. Particularly, this program is
meant for putting in threshold information, both opaque (=strict)
thresholds and transparent (=alpha fading, AKA subthreshold fading)
ones.
In AFNI, the colorbar goes with the overlay dataset, which may or may
not be the same as the threshold dataset.
-
In cases where they are the same, this program can be used to:
-
add in (striped) threshold boundary lines
-
replace subthreshold regions with a dull/null gray color
-
put in alpha-based fading (either Linear or Quadratic)
-
use values from a JSON file output by @chauffeur_afni to efficiently
gain useful knowledge about relevant cbar info, like min/max, threshold
values, ON/OFFness of alpha fading, etc.
-
-
In cases where they differ, this program might be useful for:
- representing alpha-fading as an orthogonal (=perpendicular to the
the color gradient) melding of the colorbar with a null/dull gray
- representing alpha-fading as an orthogonal (=perpendicular to the
-
In all cases, this program can:
- add a boundary of chosen thickness and color.
More functionality will likely be added over time.
Notation note: For simplicity, we mostly just refer to the colorbar or palette as a 'cbar', which should be synonymous here with 'pbar'. Some programs also refer to these as 'colorscales' or 'colormaps'.
This can be used to add lines and coloration to represent either opaque or transparent thresholding.
Many can add a pre-existing colorbar to edit, or use the name of a known AFNI one.
So, if you run this:
    colorbar_tool.py                                             \
        -in_cbar_name  Viridis                                   \
        -prefix        CBAR_Viridis.jpg                          \
        -cbar_min      -5                                        \
        -cbar_max      5                                         \
        -thr_val       3                                         \
        -alpha         Quadratic
... you get:

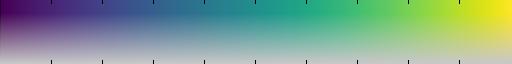
You can also denote that the colorbar values and transparency gradation are separate from each other. For example, if you use an effect estimate for an overlay and a statistic dataset for thresholding, then the following colorbar style would be more appropriate:
colorbar_tool.py                                             \
        -in_cbar_name  Viridis                                   \
        -prefix        CBAR_Viridis_orth.jpg             \
        -orth_on                                         \
        -alpha         Linear
You can also change the line coloration, add an outline, and more.
This functionality was suggested and prototyped by Dylan Nielson (NIMH, NIH, USA), thanks!
--pt