AFNI version info (afni -ver): AFNI_24.0.13
Hi everyone,
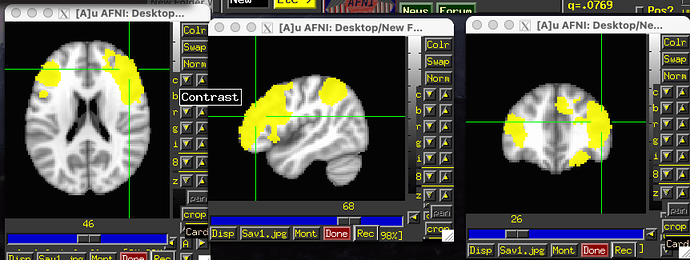
I am in the process of looking at within group functional connectivity. I have attached a screenshot of my 3dttest++ output file. After thresholding and clusterizing (as per my 3dClustsim results), i am seeing 4 positive clusters and 0 negative clusters. After i click SaveMsk and pull my z prime parameters, I am getting negative z prime values (screenshot not attached- can share if needed)- which is affecting my group level statistics.
I'm confused as to why I'm seeing only positive clusters but am getting negative z prime values? Could someone please explain what this means?
And question for those who utilize the "highlight not hide" method- is this method solely used for visualizing connectivity? Does it play a role in how we cluster and pull parameters?
Thank you in advance!
-Mit
Hi, Mit-
OK, so the clusters are known to be positive because you have only yellow blobs in the thresholded brain, right? As you click around in them, you can also see the value of where you click in the GUI itself---those values should be positive here.
Where are you seeing negative values for the cluster?
Re. highlighting: indeed, this first applies for visualizing results. Analysis considerations with "highlighting" can include report voxels/clusters that are at a less-significant p-value (like p=0.01 or p=0.005, which you might observe with transparent thresholding). It also means summarizing a cluster more informatively: not using just peak voxel or center of mass, but perhaps notable cluster overlaps with a meaningful atlas. From a meta analysis point of view, consider using correlation rather than cluster-overlap-only to compare results. Conceivably, one could use a weighted correlation, to emphasize the most significant regions in the comparison.
--pt
Hi,
Yes- so im only seeing the yellow blobs in the thresholded brain and positive values in the GUI itself.
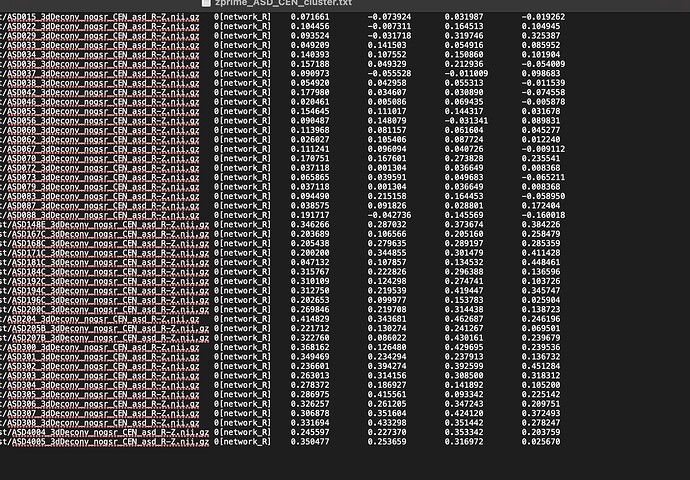
After thresholding, i am using "SaveMsk" and am getting a tlrc.BRIK and tlrc.HEAD file. I am then using 3dcalc to convert the BRIK file into an nii.gz file. After that, im using 3dROIstats to take my group cluster and r-z file to pull parameter estimates for each of my subjects. This is what im seeing after i pull the parameters estimates. Im getting values for my clusters but im also seeing negative parameters. Where are the negative parameters being pulled from if i am only seeing positive clusters in my thresholded brain?
OK. The voxel values within the volume you are thresholding should all be positive here. However, there are no guarantees that other datasets (like per-subject ones) will be uniformly positive there. Even if the average across all subjects is positive here, that doesn't require each individual value to be positive itself. (And I'm not sure what an r-z file is).
--pt
1 Like


