I am on the search for an AFNI command that could calculate a Pearson correlation coefficient for each voxel with a single covariate, e.g., age, cognition, etc.
I did try something similar with 3dttest++, by setting up a one sample analysis with a covariate option. But that inverses the independent vs. dependent variables I want to test (desired direction: fmri->cognitive performance ; what 3dttest does: cognition -> fMRI).
I know Matlab can calculate voxelwise correlation coefficients but would there be an AFNI command that would let me do this?
I also want to calculate voxel-by-voxel correlation between a pair of 3D images for X number of people, e.g., an ALFF image vs. tau scan. Would it make sense to stack each image across all participants as if it is a timeseries and then ran a 3dTcorrelate like below?
Regarding your first question: if your goal is to estimate the correlation between the hemodynamic response and another variable (e.g., age, cognitive measures), you can use programs such as 3dttest++ or 3dMVM and then convert the resulting statistics to Pearson correlation coefficients. If, however, your interest is in assessing associations more generally rather than correlation per se, then the distinction between explanatory and response variables becomes important. We can discuss the modeling strategy once you clarify the situation.
For your second question: yes, you can treat the two datasets as time series and use 3dTcorrelate to compute their correlations. Other approaches are certainly possible, but this workaround is technically straightforward and should work as intended.
Thank you for your response! I'm exploring at this stage so I would like to know how I can convert resulting statistics from 3dttest++ or 3dMVM to a correlation coefficient.
The relationship between the t-statistic and the coefficient of determination is given by
R^2=\frac{t^2}{t^2+DF},
where DFDFDF denotes the degrees of freedom associated with the t-statistic.
By taking the square root of R^2 and assigning the sign of the t-statistic, the corresponding Pearson correlation coefficient can be recovered. This can be implemented in AFNI using 3dcalc as follows:
3dcalc -a t-stat \
       -expr '(ispositive(a)-isnegative(a))*sqrt(a*a/(a*a+DF))' \
       -prefix corr
Thank you for your response. Would it be okay if you revisited where DF would come from? If I were to examine 40 participants, would it be 39?
Also, I thought 3dttest++ could be used like a multivariate regression model so I did something like below.
deepimage:~/Desktop/IMAGES/analysis_jan2026> tcsh -xef multivariate
set dirA=/home1/gc748/Desktop/IMAGES
cd /home1/gc748/Desktop/IMAGES/analysis_jan2026
3dttest++ -prefix lowamp_multivariate -mask /home1/gc748/Desktop/fsl_gawon/data/standard/MNI152_T1_2mm_brain_mask.nii.gz -setA all 1 image.nii.gz 2 image.nii.gz .... image40.nii.gz -covariates /home1/gc748/Desktop/IMAGES/analysis_jan2026/experiment_multivariate.txt
++ 3dttest++: AFNI version=AFNI_24.0.12 (Mar 12 2024) [64-bit]
++ Authored by: Zhark++
++ 228483 voxels in -mask dataset
++ option -setA :: processing as LONG form (label label dset label dset ...)
++ have 56 volumes corresponding to option '-setA'
++ Covariates file: 3 columns, each with 56 rows
 + Covariate column labels: sub;language;execf
 + Found 2 numeric columns: language execf
++ loading covariates
++ loading -setA datasets
++ t-testing:0123456789.0123456789.0123456789.0123456789.0123456789.!
++ ---------- End of analyses -- freeing workspaces ----------
++ Creating FDR curves in output dataset
++ Smallest FDR q [1 all_Tstat] = 1.05504e-15
*+ WARNING: Smallest FDR q [3 all_language_Tstat] = 0.346969 ==> few true single voxel detections
++ Smallest FDR q [5 all_execf_Tstat] = 0.0273785
 + Added 3 FDR curves to dataset
++ Output dataset ./lowamp_multivariate+tlrc.BRIK
++ ----- 3dttest++ says so long, farewell, and happy trails to you :) -----
But images that I get from this analysis are the following six, which seems to me to each examine association between my voxelwise image values and language and execf respectively, not controlling for both at the same time. Would there be a way to do this or am I using this command in a wrong way?
To extract the degrees of freedom (DF) for a statistical sub-brick, you can use the following command for the t-statistic sub-brick corresponding to all_language:
The last number in the output corresponds to the degrees of freedom.
However, the output of this analysis consists of six images. My understanding is that each image reflects the association between the voxelwise response and either the language or executive-function variable separately, rather than estimating their effects jointly (i.e., controlling for both predictors simultaneously). Is there a way to model the association while controlling for both variables at the same time, or am I misunderstanding how this command and the resulting outputs should be interpreted?
To help clarify this issue, could you please specify:
what the response variable is,
what the explanatory variables are, and
how they are related in your statistical model?
Having this information would make it easier to understand your analytical goal and determine whether the current approach is appropriate.
So my response variable is a 3D volume where each volume is an average BOLD summary metric. Explanatory variables are executive function and and language, which are regressed on the 3D volume.
Among the three variables of executive function (EF), language (L), and hemodynamic response (HDR), what are their causal relationships? Suppose the underlying structure is
L \rightarrow HDR, EF \rightarrow HDR, EF \rightarrow L
Under this assumption, I suggest the following strategy:
When examining the association between L and HDR, include EF as a covariate, since EF is a common cause of both.
When examining the association between EF and HDR, do not include L as a covariate, because L lies on the causal pathway from EF to HDR and adjusting for it would block part of the effect of interest.
A more general discussion of covariate selection and its causal implications is provided in this blog post.
But I'm a still a bit confused which one of the output images I should use.
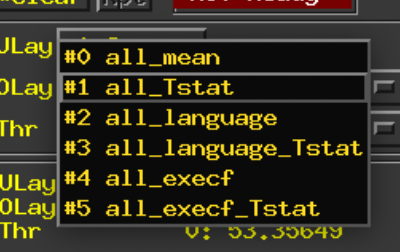
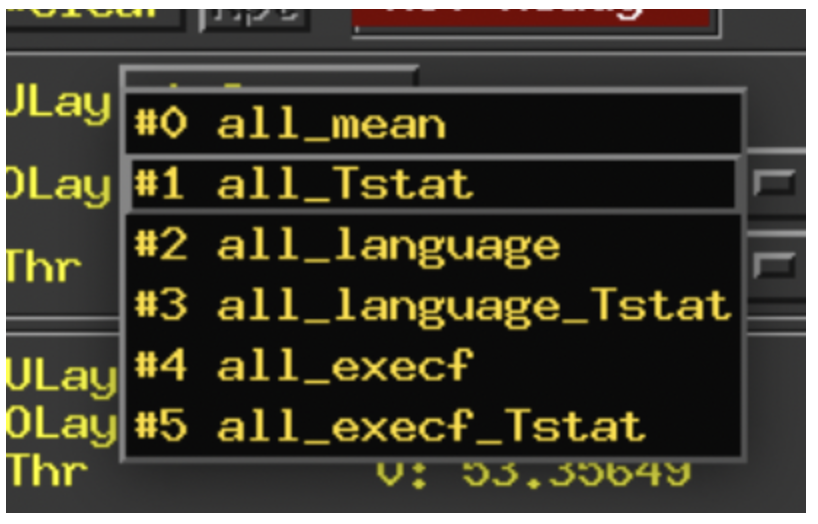
Below is a screenshot of the list of images I got when I tried to examine the relationship between L-> resting-state HDR, controlling for EF as a covariate. I'm also attaching the code that I used to do this below. The point I am confused about is which of these images (#0-#5) is telling me the association between L-> resting-state HDR after controlling for executive function? Is it image #3 that is telling me the strength of association between L-> HDR after adjustments for execf?
I assume the visualization you’re showing is based on the following model:
y \sim \beta_0 + \beta_1 \text{language}+\beta_2 \text{execf} + \epsilon
I am confused about is which of these images (#0-#5) is telling me the association between L-> resting-state HDR after controlling for executive function? Is it image #3 that is telling me the strength of association between L-> HDR after adjustments for execf?
If your hypothesized causal structure is that both L → HDR and EF → HDR exist, and EF also influences *L, then \beta_1 is your coefficient of interest. In your analysis output, this corresponds to sub-bricks #2 (coefficient/beta) and #3 (t-statistic/p-value). These sub-bricks reveal the unique association of language with the HDR after adjustments for executive function.
I believe the model you specified, regressing y on beta1, beta 2, and error is what I specified. But would be great if I could double check that with you. This is the code I used, where I kept everyone's image in setA, and the covariates file had two columns each for language and executive function. Would this estimate the model that you specified?
Your 3dttest++ setup correctly implements a regression model to assess the relationship between language and BOD with executive function as a covariate; the specification looks sound.
The
National Institute of Mental Health (NIMH) is part of the National Institutes of
Health (NIH), a component of the U.S. Department of Health and Human
Services.