Howdy-
In many cases, we apply blurring to FMRI data during processing, to help boost local TSNR (at the cost of some spatial resolution). This is commonly done for voxelwise analysis, and we are often used to seeing results with that bit of blur, esp. seedbased correlation maps.
There are also times we would not want to blur the data, like when doing an ROI-based analysis (for more discussion of this, see Sec 4.7 "Considerations when setting up FMRI pipelines" here and/or this OHBM-2025 poster). This poses a challenge, however, for some QC evaluation aspects, however, particularly in the APQC HTML:
- The automatically-generated seedbased correlation maps in known template spaces will necessarily look sparser without blurring.
- The corr_brain maps will look sparser without blurring.
- The TSNR summaries will flag a lot more locations as worrisome, as each voxel's values will necessarily be lower.
So, to help with QC judgments of FMRI data that have not been blurred, from AFNI ver=25.2.15 and onwards we have some new features.
-
Seed-based correlation maps
This applies to non-task FMRI data. There will now be a blurred version of theerrts*(=residual) dataset, created, and used for the seedbased correlation presented in the QC HTML.-
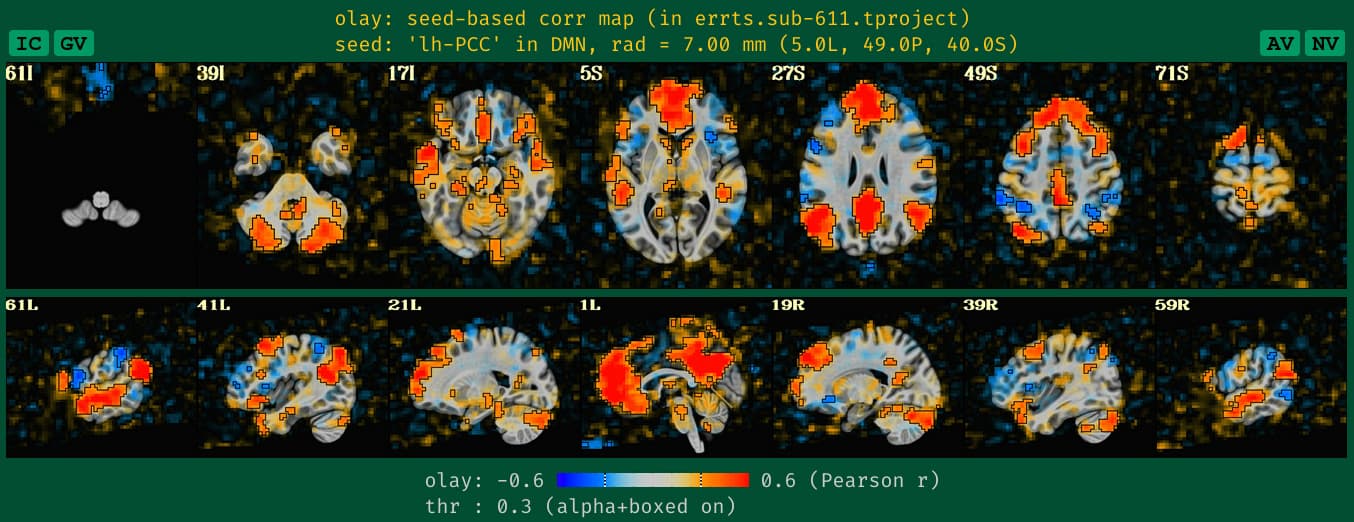
what the QC HTML image looks like the DMN seedmap with blurred data, which is what we are used to seeing+interpreting:
-
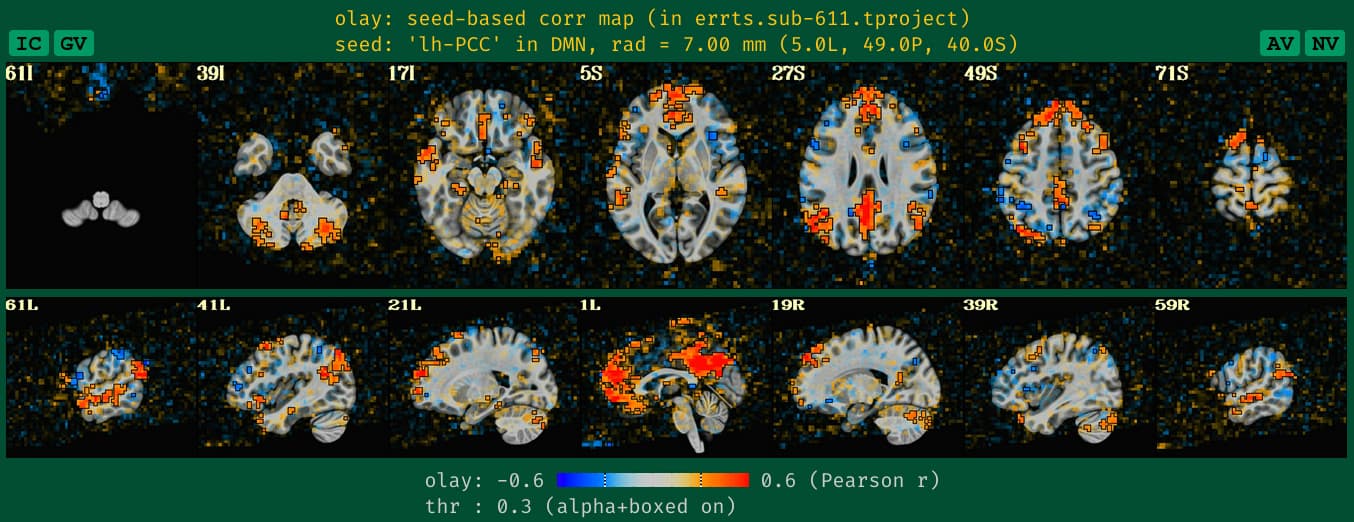
what the old QC HTML image looked like for the DMN seedmap with unblurred data, which is a bit sparse and hard to judge accurately, based on our typical experience:
-
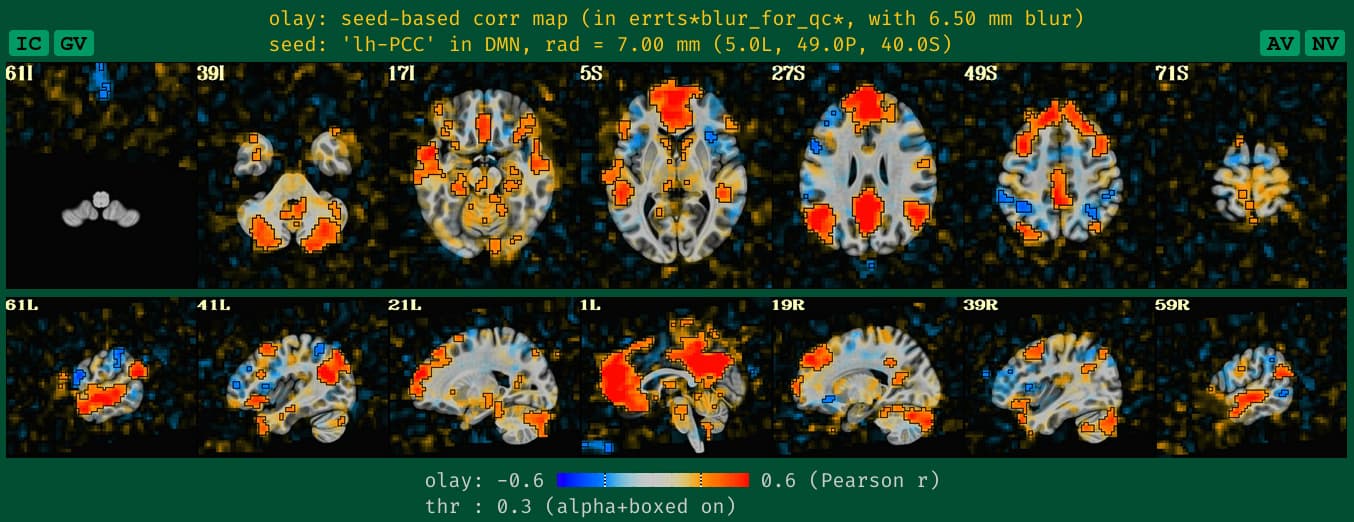
what the new QC HTML image looks like for the DMN seedmap with unblurred data, which is more in line with how it would look if it had been given a standard blur during processing:
See how the new QC HTML is more directly interpretable. It also will likely make QC issues more easily detected, which is helpful.
-
-
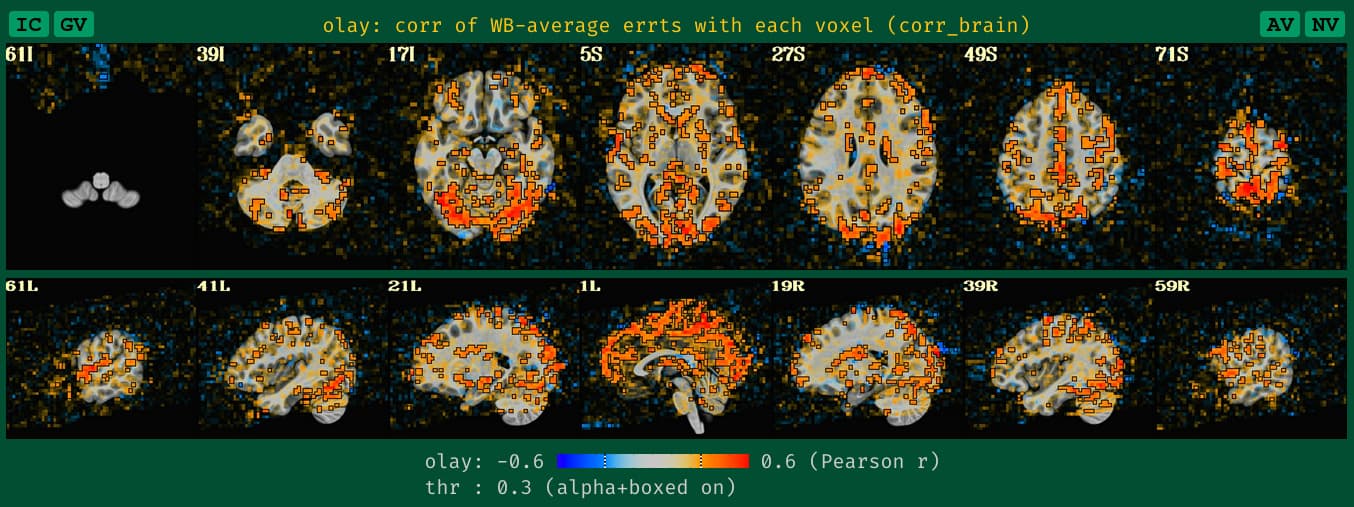
corr_brain maps
This applies to both task-based and non-task FMRI. And this update is analogous to the seed-based correlation maps. We now create a blurred version of the corr_brain data when no blurring is applied during processing, to make it more reasonably interpretable, based on our usual way of looking at it.-
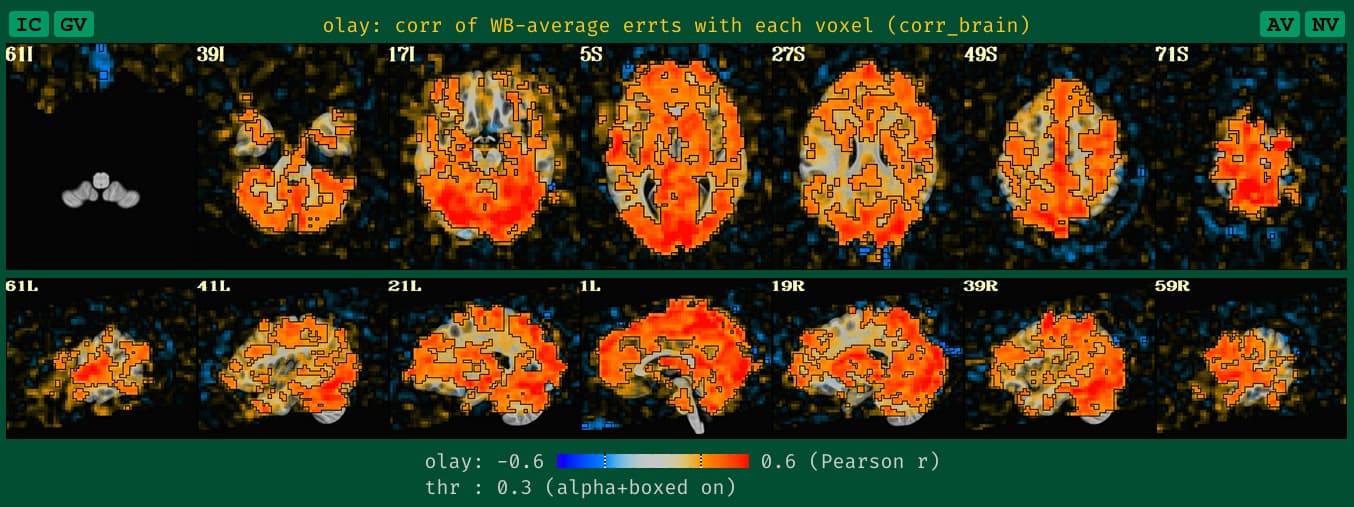
what the QC HTML image for corr_brain looks like with blurred data, which is what we are used to seeing+interpreting:
-
what the old QC HTML image for corr_brain looked like with unblurred data, which is a bit sparse and hard to judge accurately, based on our typical experience:
-
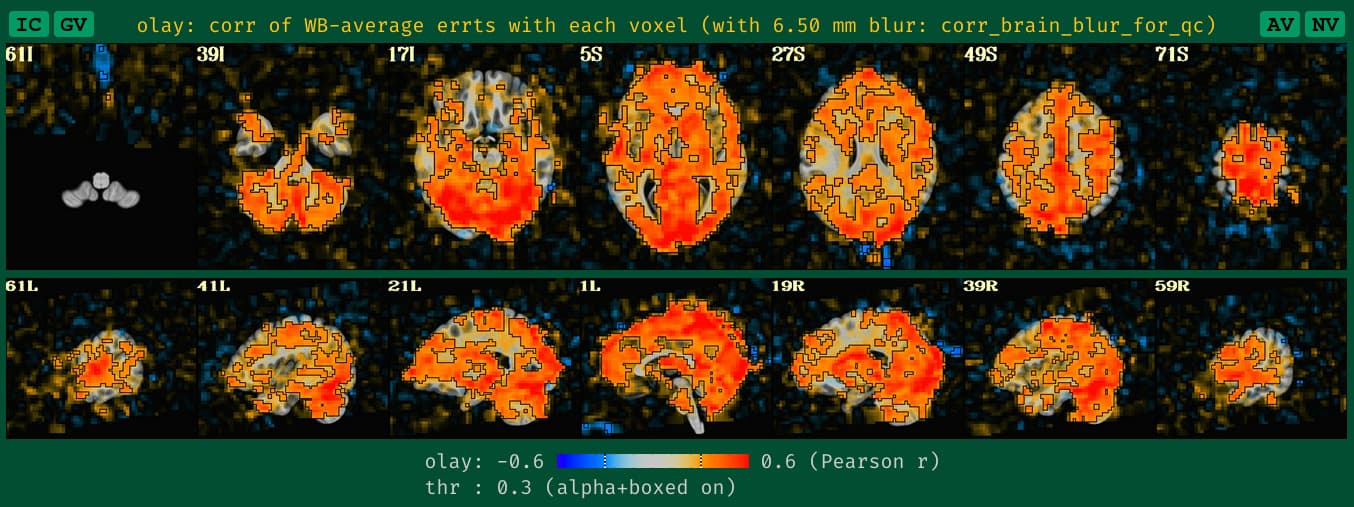
what the new QC HTML image for corr_brain looks like with unblurred data, which is more in line with how it would look if it had been given a standard blur during processing:
Note that the corr_brain information also ties in with the GCOR quantity that we calculate and use for QC checks (see here and here). We have observed, anecdotally, that one would expect the GCOR in non-blurred data to be about 4 times less than that of blurred data. So, if you are using gen_ss_review_table.py to check your quantitative summary features from the afni_proc.py processing and GCOR is something you check (it should be!), then you would want to lower your threshold by a factor of 4 if you don't blur your data, compared to if you did blur your data.
-
-
TSNR table
This applies to both task-based and non-task data. This is a challenging one. Blurring data smears out signal to surrounding voxels. Thus, it spreads information across region boundaries. If you are doing a region-based analysis, this would artificially boost similarity in neighboring regions, hence why you should not blur data if you are going to do an ROI-based analysis. NB: the TSNR boost that comes with blurring will still occur in the ROI-based analysis, but just when you average time series within each ROI (that is just a different way to blur, but it doesn't smear signal across region boundaries).Since the TSNR per voxel can be expected to be lower, we set the warning levels for uncertain/mild/medium/severe lower by a factor of 2/3rds or so when the data are not blurred. So, instead of a mild warning starting below TSNR=100, a mild warning for non-blurred data will start at TSNR=70. This is not an exact science, but by checking the relative TSNR across several different datasets, this seemed a fairly comparable mapping.
Hope these updates help with QC evaluations!
--pt