Hi everyone!
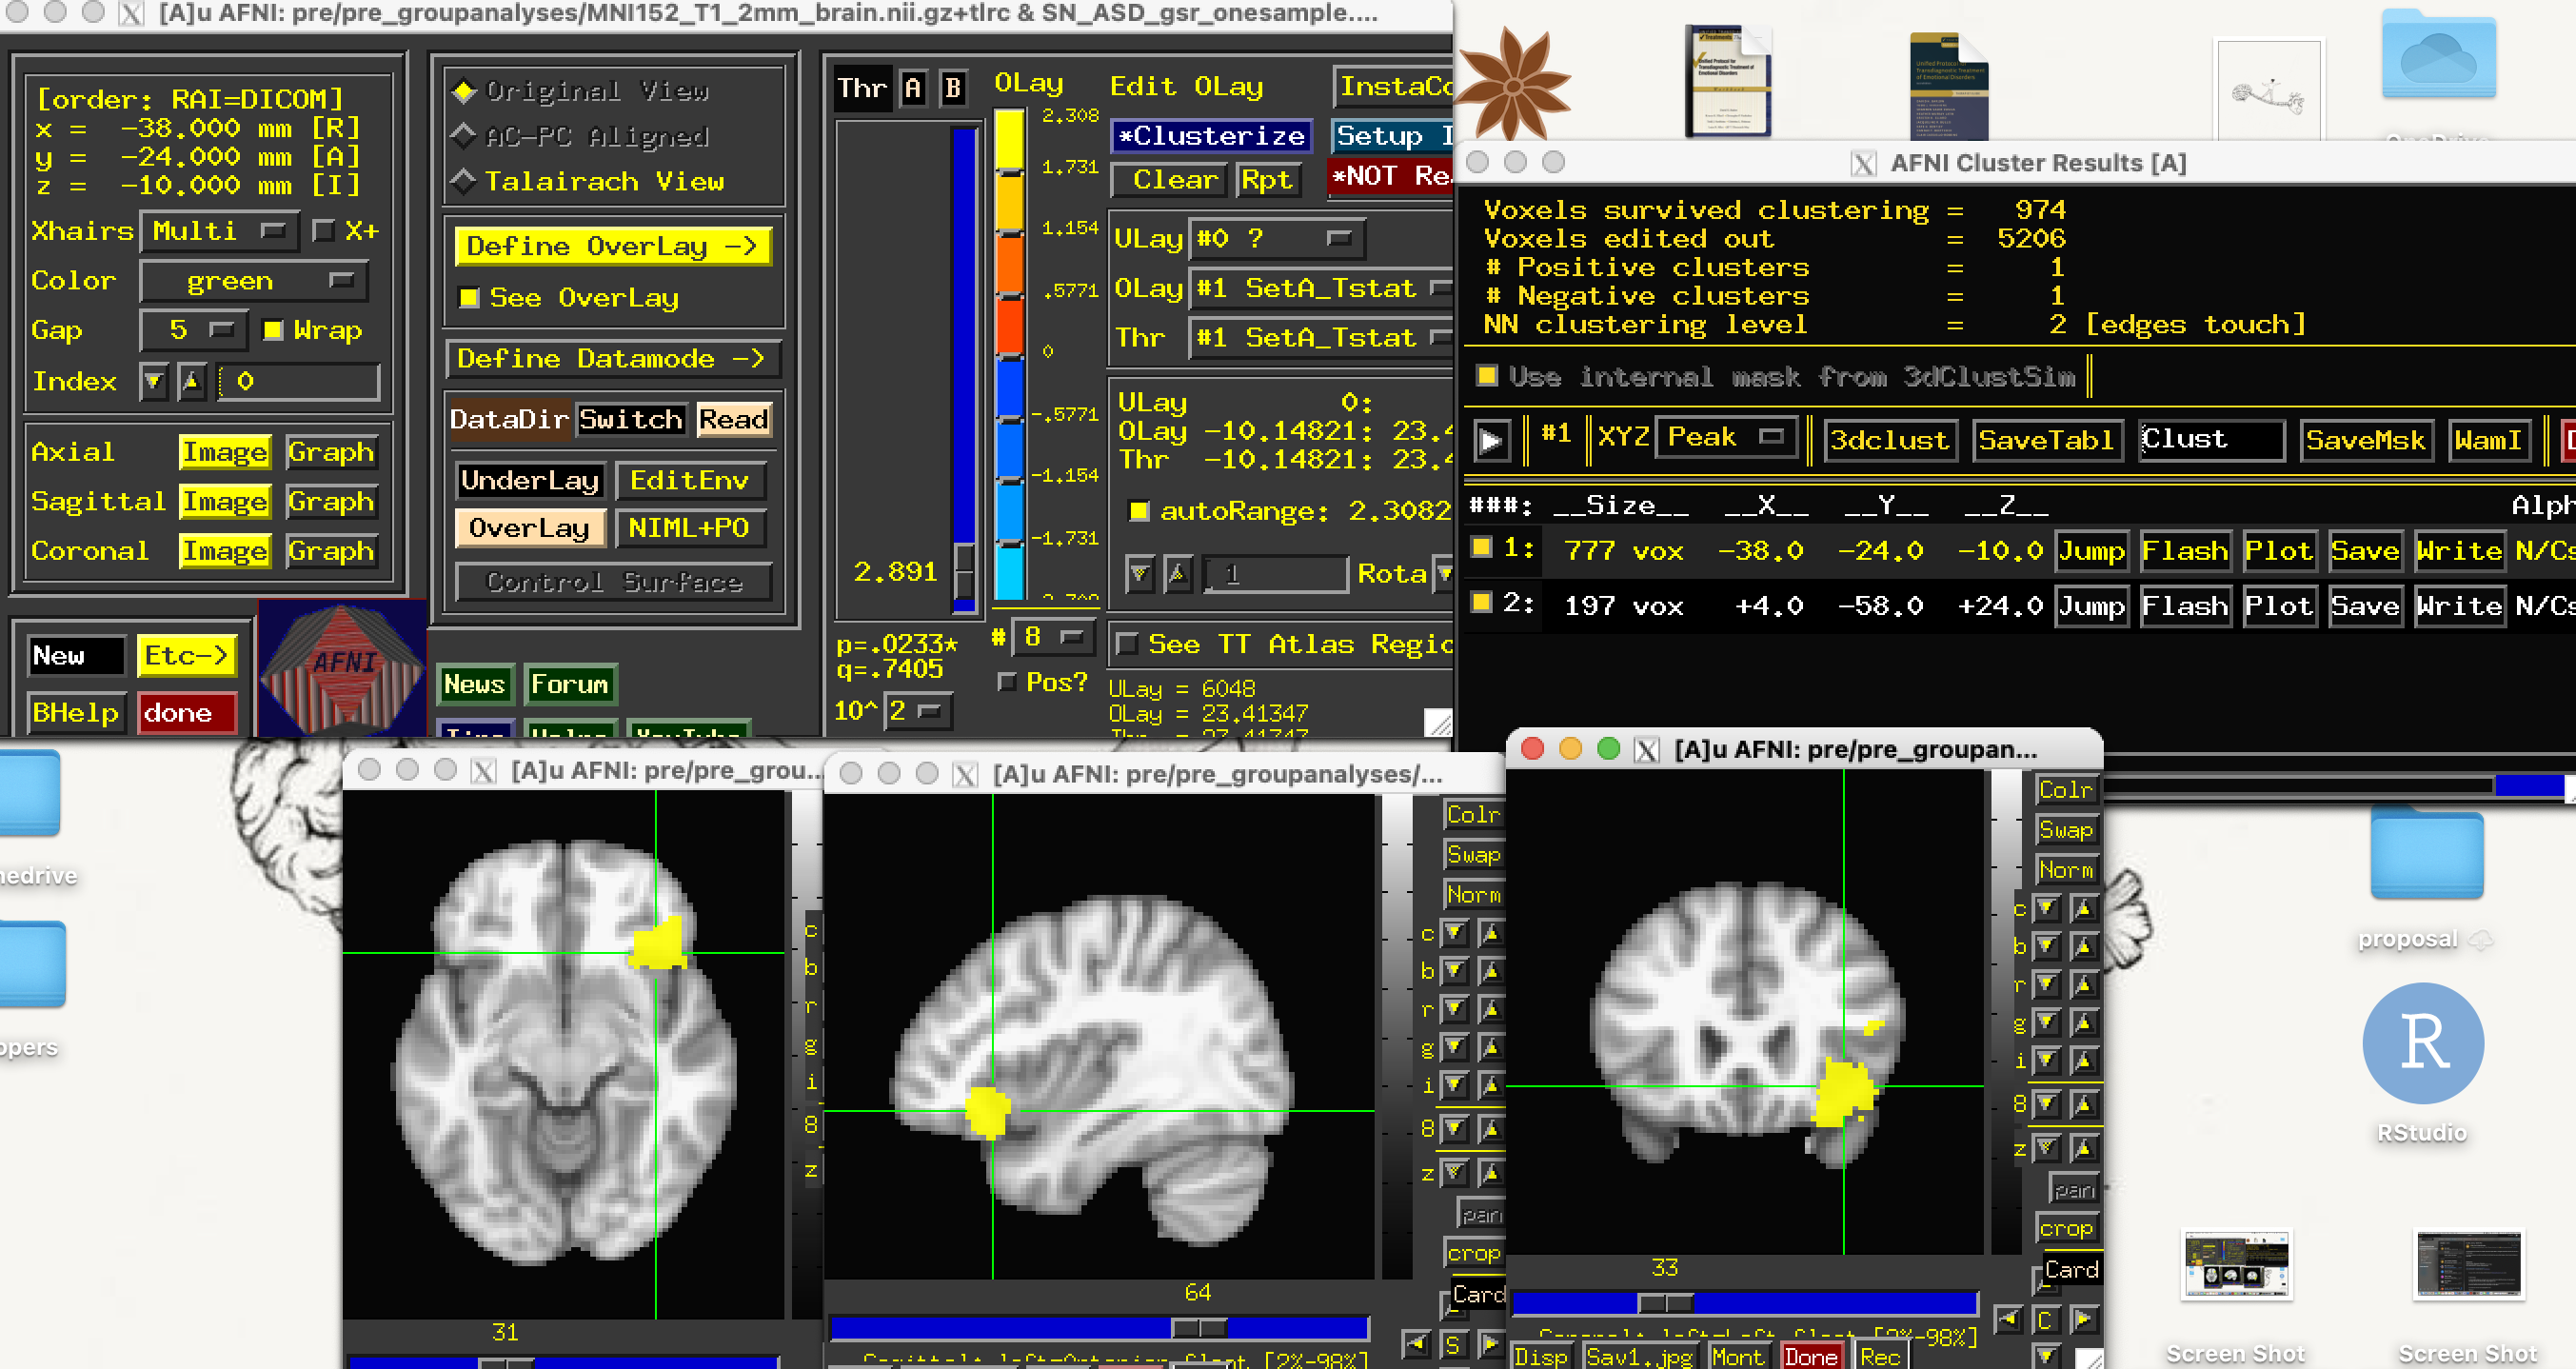
We're running 3dttest+ for our one-sample and have a sample size of 9. We have a 5mm ROI in the right anterior insula (we're looking at salience network- whole brain functional connectivity). Our within group analyses output file only shows a larger voxel cluster (700+ voxels) in the right anterior insula, and much smaller voxel cluster (200 clusters) in another area.
We aren't sure if these smaller clusters would survive cluster correction.
Since we're only seeing a significant cluster in the ROI area, are we doing something incorrectly?Or are we interpreting the output incorrectly? Or Is this a power problem where we dont have a large enough sample size to see significance in more clusters?
All and any advice is appreciated! Its conference season and we're running into this right before abstract deadlines :)
Thanks!
-Mit & Hector
AFNI version info (afni -ver):
code text # or delete if not needed
Hi, Mit & Hector-
There are a couple separate issues here.
To start, just to be clear, am I correct that you have calculated seedbased correlation maps for 9 subjects, and then do a one-sample t-test of those?
- The one-sample t-test will output two things: 1) the mean effect at each location (so the mean of your seedbased correlation maps, per voxel), and then 2) an associated t-statistic (basically the ratio of the mean to the uncertainty at each voxel).
- In most neuroimaging cases, on will expect some high correlations around the area of the seed itself, and then possibly other regions with high correlation. The latter are typically more of interest, because those tell a bit about relations of different parts of the brain.
- Both the effect and the statistic contain useful information and should be displayed. This is something we promote a lot and the AFNI GUI is built to facilitate this. It is described in this thread:
Basic question about value in olay panel
Basically, you can put the t-test effect estimate as the "overlay" volume, and then set the t-test statistic as the "threshold" volume.
- ... and even better, you can display your results with transparent thresholding, to show more of your data, which is also described in that thread, as well as in this paper (jumping to Fig 1 there, and emulating the lower panel image there is highly recommended).
--pt
Regarding clusters, you can estimate cluster extent for statistical adjustment/thresholding by estimating the typical spatial extent of autocorrelations of noise/residuals of your modeled time series. That is possible, and then you estimate how large a cluster should be to be above a certain probability of occurring randomly at a particular voxelwise threshold. If you want to estimate that, we can discuss it.
Your current cluster seems pretty large, but it really depends on the smoothness of your data and would have to be estimated from it.
--pt