Howdy-
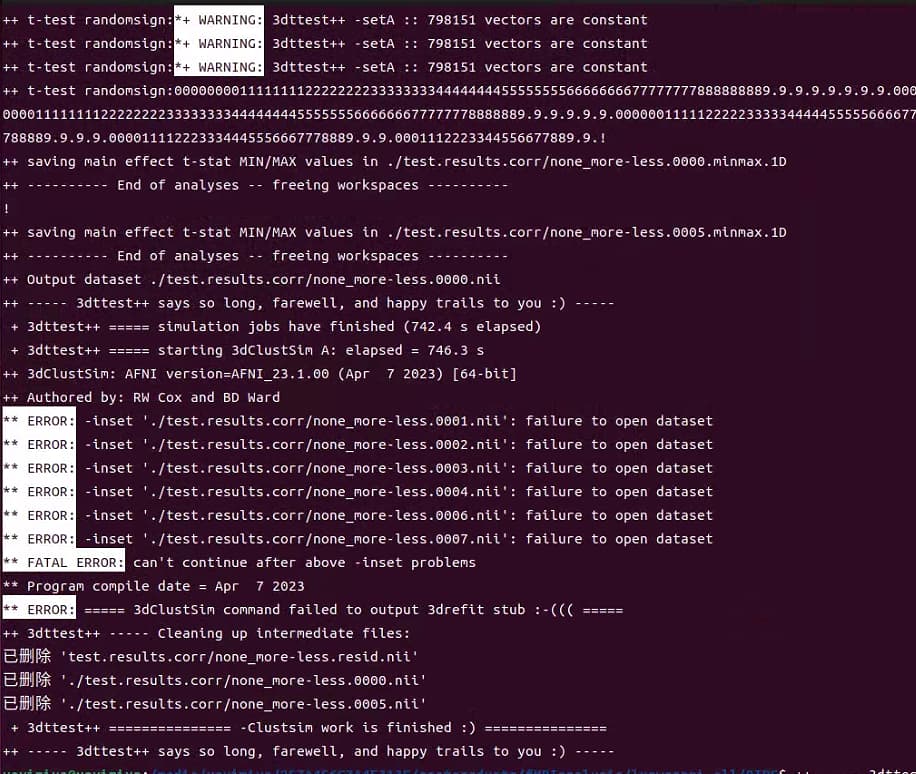
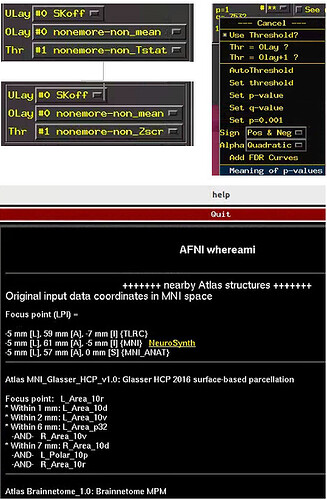
->The first question is that the results generated without -Clustsim option has mean and Tstat values, the results generated with -Clustsim option has became mean and Tstat values. It's this change right?
Yes, the dataset output of 3dttest++ with or without -Clustsim contains the mean and associated Tstat (you could use this option to output Z-scores instead of t-stats -toz = Convert output t-statistics to z-scores). What you get in addition by running with -Clustsim is an associated set of text files, based on simulations of residuals with random signflipping, that provide estimates of clustersize thresholds, for a given voxelwise threshold and desired FWE value. Similar tables would be output by 3dClustSim, based on estimated spatial smoothness of noise.
->The second question is that There are two ways to multi-contrast correction: FDR and FWE. FDR need to set q value, I have seen "set q-value" in overlay GUI, So, do I just need to set the q value here (e.g. q=0.05), and the FDR multiple comparison correction is done?(But I still need to use clusterize button to know where these activated voxels are? set the clust size zero?)
Maybe "adjustment" is a better term than correction. FWE and FDR are different approaches for adjusting statistical estimates/interpretations in the face of massively univariate testing: something like 60,000 or more voxels are analyzed in parallel, and when thresholding results people want to reduce the expected numbers of false positives present in their final results (i.e., reducing Type I statistical error). FWE and FDR aim to control slightly different rates: FDR performs adjustment to control the expected number of false positives within the rejected null hypotheses; FWE aims to control the false positive rate across all tests performed.
It is important to note that they were designed for different kinds of problems (FDR was specifically for genomic analyses, which has particular size and types of data) but have generalized attributes, too. For both FWE and FDR, there are maaany flavors and styles of correcting---there is no single one right answer. There are at least 3 different versions of FDR with Benjamini (one of the main originators of this) as an author. Many choices might depend on assumptions about the data itself.
In MRI, for voxelwise analyses, most people do FWE (and more specifically, typically with clustering). FDR is possible to do as well, converting stats to q and performing adjustments. These would not be mixed within a single analysis. In AFNI, one would do FWE with: 3dttest++ and either Clustsim or ETAC, or with 3dClustSim. One would do FDR with 3dFDR---note that there are different forms of FDR within 3dFDR, as described in the help. From some recent discussions, it would probably be best to include the -old option (and a brainmask), to use a more classical FDR for most purposes; the -new approach (and current default) has a second level of correction, and might be more assumption-laden.
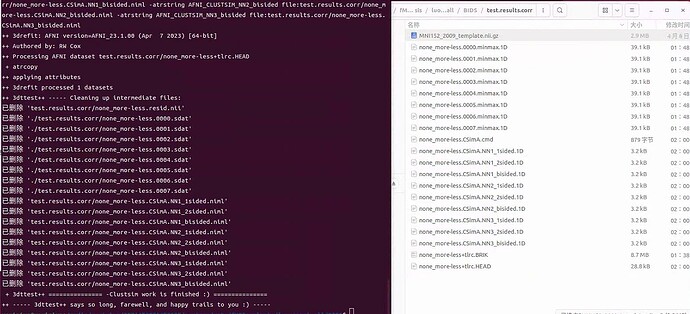
->The -Clustsim option is to calculate FWE correction, As you told me, fist I need to set voxel threshold(e.g. p=0.001), then I need to search the *sided.1D files to find the the cluster size corresponding to the cluster threshold, set the clust size in clusterize GUI, the FWE multiple comparison correction is done. Is that right?
I guess I would phrase it as: within your chosen *sided.1D file, go to the row of your desired p-value and the column of your desired FWE value---remember the clustersize at their intersection. Then go to the GUI and put the stats dset as the threshold volume, threshold the data at the value corresponding to your p-value, and then Clusterize using the NN and clustersize value from your *sided.1D file. (And probably also use the A and B buttons in the GUI to threshold transparently!) That is applying the FWE adjustment. Note taht you can also use 3dClusterize on the commandline to create output datasets--it is run by the Clusterize button in the GUI. In the GUI's clusterize report, there are buttons to save your cluster dset to disk: the "3dclust" button shows the command in the terminal, and the "SaveMsk" button saves the dset to disk.
->There is a small question at the end here.I want to know the brain region where the activation cluster is located.When I open the rpt GUI and jump to a activated clust, I Right-click at image and select "Where Am i", I use MNI152_2009c for template, but I didn't find an atlas corresponding to MNI152_2009c in the whereami GUI.There should be differences in the brain regions corresponding to different templates(e.g. MNI152 & N27). How do I get the activation locations in the atlas corresponding to MNI152_2009c.
The Glasser atlas should be assosciated with the MNI152_2009c dataset?
It is also possible to run whereami on the command line, using a cluster map as input and an atlas as a reference, such as here with the Glasser atlas:
whereami                                    \
    -omask DSET_CLUST                       \
    -atlas MNI_Glasser_HCP_v1.0
--pt


