3dPeriodogram and 1dFFT - How exactly is the power computed?

Dear all,

after using 3dPeriodogram for a longer time now, I stumbled across a strange “problem”. I am interested in computing power spectra and additionally I am interested in computing the slope of a linear regression in the log-frequency log-power transformation of the frequency-domain, namely the power-law exponent (PLE).

Here are two options how to accomplish this, while option 1 is clearly prefered.
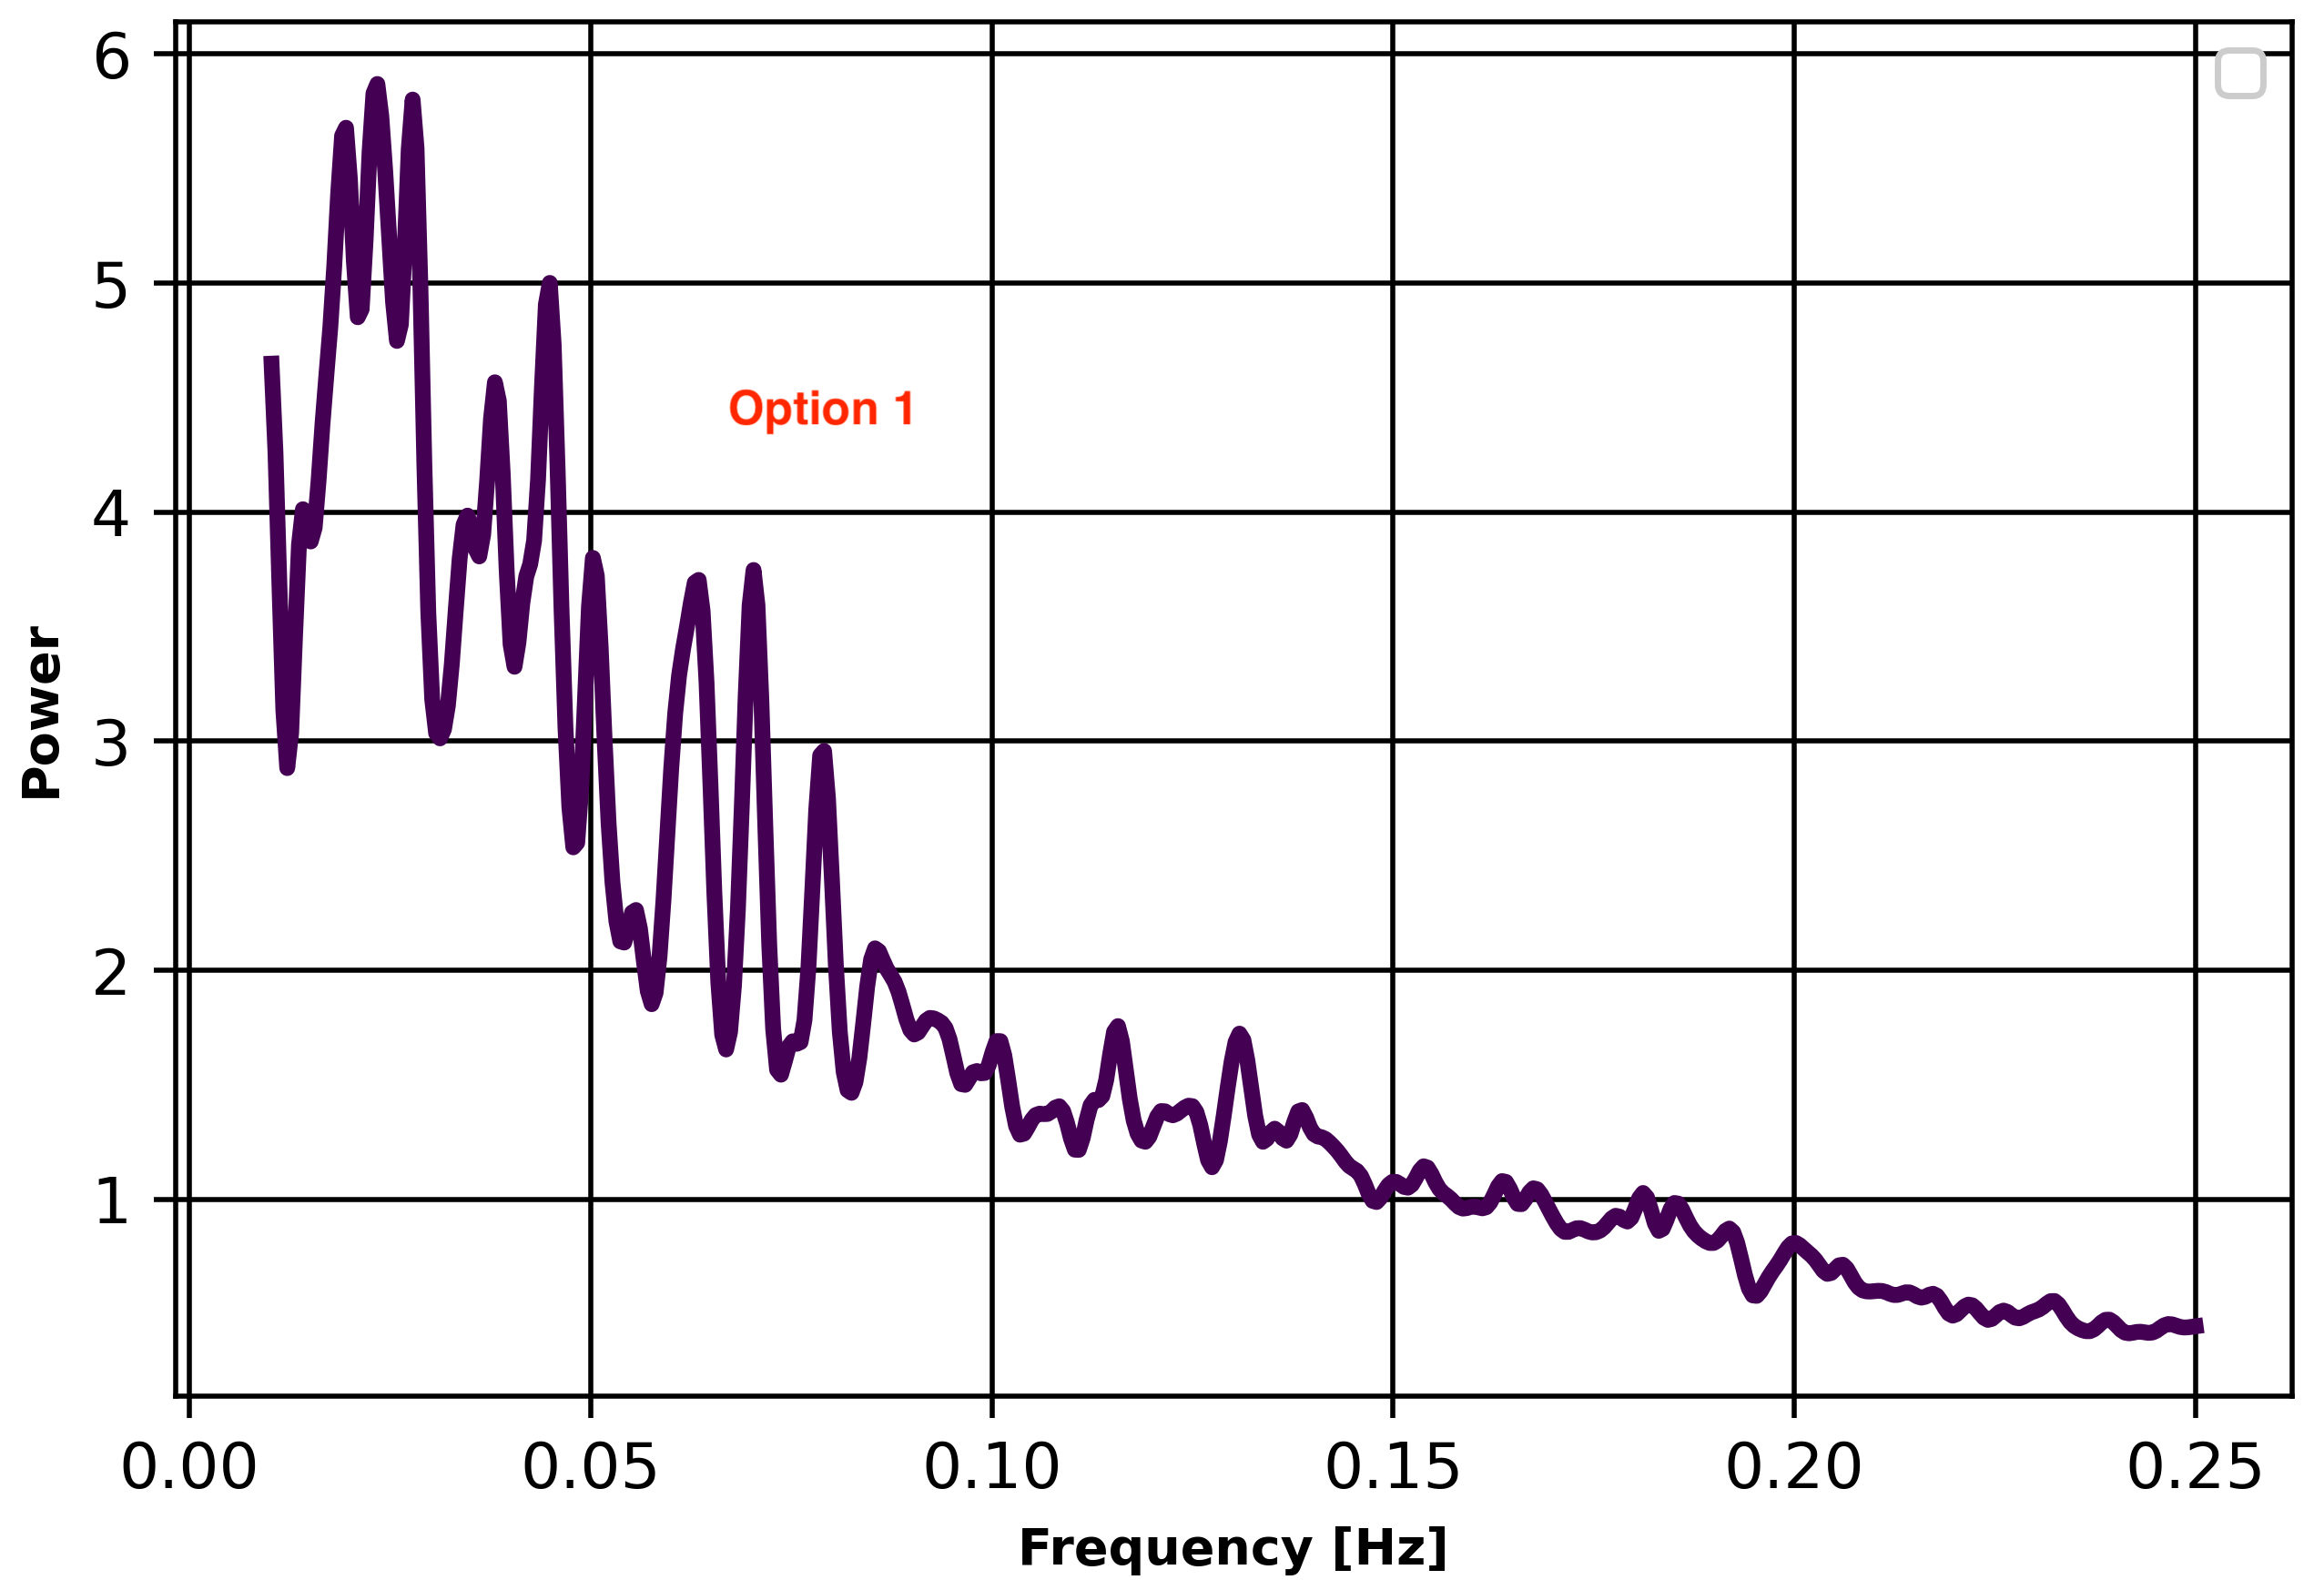
Option 1:

  • Use 3dPeriodogram on every voxel in AFNI on the preprocessed time-series.
  • Cut the 3dPeriodogram results to the desired frequency range via 3dTcat.
  • (Optional: use 3dcalc to log the data, or log them later via numpy in Python).
  • Extract the results via 3dmaskave into a .1D or .txt file (this provides the average of all voxels’ Periodograms for a desired ROI).
  • Load this 3dmaskave result into Python and compute the slope.
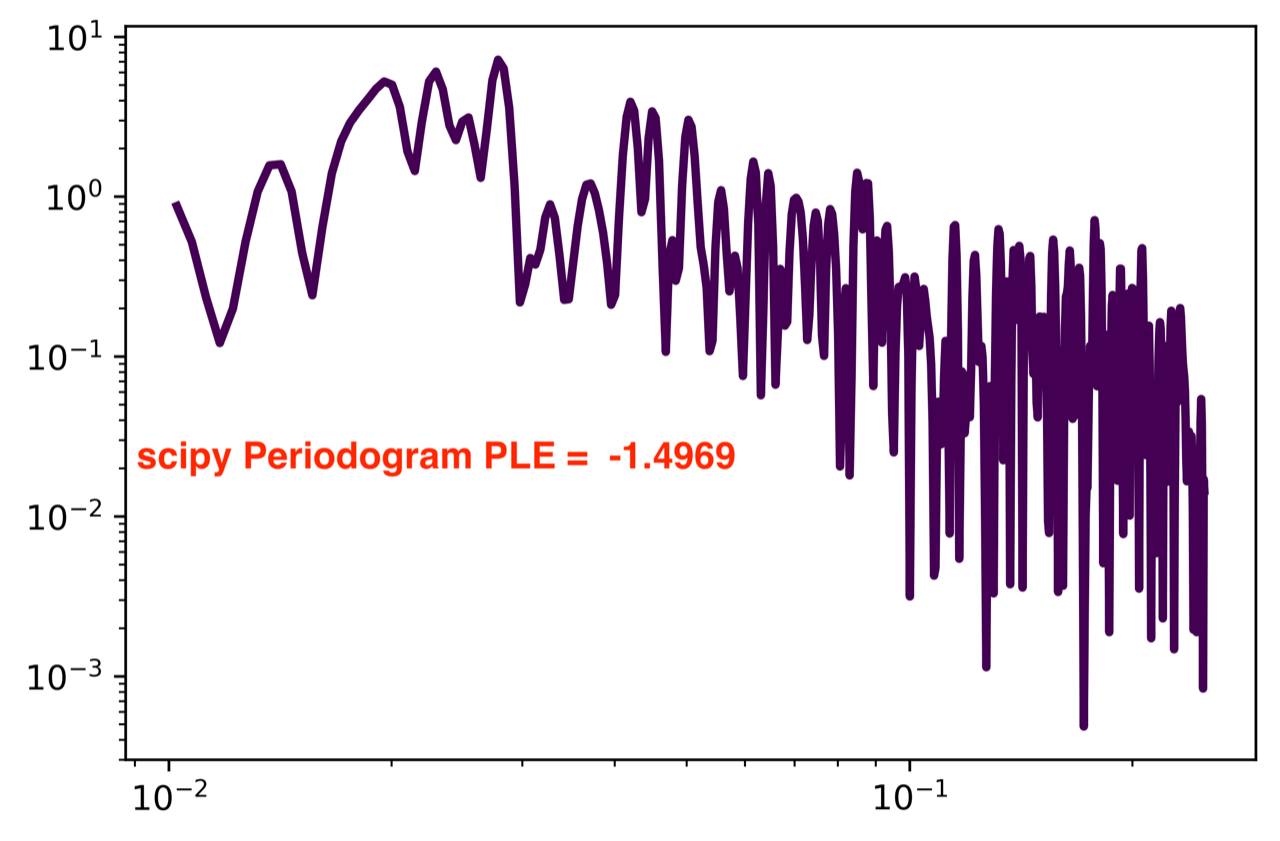
Option 2:

  • Extract the preprocessed time-series with 3dmaskave choosing the desired ROI.
  • Load the .1D or .txt file (the average across all voxels’ time-series) into Python.
  • Use scipy Periodogram to transform the time-series into the frequency-domain.
  • Log-log the Periodogram (the frequency and data) and compute the slope of log-frequency and log-power.

Both results should yield more or less the same power-spectra and PLE (I heard so). A lab colleague who is very experienced with EEG recommended option 1, since they average the power spectra across the single electrodes as well.
Option 1 yields a PLE of ~ -0.8, while option 2 yields a PLE of roughly twice the value, namely ~ -1.6. This “problem” is not related to my Python script (I am 99% certain about this!), not to a specific subject. But the problem must stem from something that 3dPeriodogram simply does different than scipy Periodogram and scipy Welch.

True, in option 1, we average thousands over thousands of Periodograms (across the voxels, it is a huge ROI), while in option 2 we average thousands over thousands of time-series. But this should not result into such a massive power spectra (see attached images) and PLE difference.

Furthermore, when I take the 3dPeriodogram or 1dFFT results ^2 (square them) in Python before applying log-log and the linear regression on them, they yield approximately the same results as scipy Periodogram or scipy Welch. Is precisely THIS related to the “problem” I am having here? I no longer know which power spectra and PLE values to trust, either the one from option 1 or option 2, since I have no ground truth.

I know that this is probably not directly an AFNI related problem, but the main question here is if 3dPeriodogram and 1dFFT do something so differently compared to the scipy Periodogram method that the power distribution between both methods looks so different (see the attached images).
The options in scipy Periodogram are all matched to 3dPeriodgram (window = Hamming; scaling = Density, nfft = the same, fs = matches to TR, detrend = linear, etc). But I tried out several options anyway, the basic problem remains.

Philipp

Hi, Philipp-

I admit I got a bit lost in the description about what the actual question was. Can you please rephrase it directly?

If you are wondering about a factor of 2 difference in a log-plot-based comparison, then I suspect one “power” method is actually calculating magnitude—that is, power is (magnitude)^2, and when you take the log of that, the 2 comes down on the lefthand side:
log(magnitude^2) = 2 log(magnitude).
You are migrating among many software, so it is good to make sure what is being calc’ed in each—first whether it is really power or magnitude (=amplitude), and second that log() is really the consistent base of logarithm you want.

–pt

Hi Paul,

the first question would be: what do 3dPeriodogram and 1dFFT really compute – magnitude or power, as you say?
Do they compute magnitude on the y-axis, so that I have to square their results (^2) or (**2 in Python) to get power?

The description of 3dPeriodogram says:


The result is the squared magnitude of the FFT of w(k)*data(k),
  divided by P.  This division makes the result be the 'power',
  which is to say the data's sum-of-squares ('energy') per unit
  time (in units of 1/TR, not 1/sec) ascribed to each FFT bin.

But I lack the understanding and knowledge to understand if that is the same as what I would compute in scipy Periodogram. It seems not to be the case, since the 3dPeriodogram PLE (slope of the linear regression) – that is to say the PLE computed based on the frequency-domain created by 3dPeriodogram – is roughly half the size of the one that I compute in scipy Periodogram or scipy Welch.

In other words: the 3dPeriodogram power spectra seem to result in a different power distribution in the frequency-domain, even though the description of 3dPeriodogram states that the result is “power”.

Edit: I think I got it. https://docs.scipy.org/doc/scipy/reference/generated/scipy.signal.periodogram.html

Scipy states that:


Selects between computing the power spectral density (‘density’) where Pxx has
units of V**2/Hz and computing the power spectrum (‘spectrum’) where Pxx has units of V**2,
if x is measured in V and fs is measured in Hz. Defaults to ‘density’

That would mean that I have to take the square root of the scipy results in order to obtain compareable results with the output of 3dPeriodogram, correct?

Philipp

Hi, Philipp-

This reply talks about AFNI’s 3dPeriodogram, and scipy’s scipy.signal.periodogram(); I refer to the latter here as sps.periodogram().

So, neither of the programs involve logs—that is not an issue here (you can take log after).

You can taper approx. similarly in each program—in my example, I will not taper, for simplicity. Therefore, 3dPeriodogram divides the power values by N, following the help note “(if ntaper = 0, then P = npts).”, to get a power density. As noted just below, sps.periodogram() will also scale in some way—setting kwarg scaling=‘density’ matches with AFNI.

Each program by default detrends the time series: 3dPeriodogram detrends to first order (so, constant+line); sps.periodogram() by default to ‘constant’. So, this is a difference in the two programs. At present, 3dPeriodogram has no option about changing this. In sps.periodogram(), you can set the kwarg detrend=‘linear’, to match 3dPeriodogram.

In terms of power vs magnitude: 3dPeriodogram estimates power spectrum (only); sps.periodogram() can do different ‘scaling’ types, as they call it. The kwarg scaling=‘density’ (default), what is called power spectral density, matches with 3dPeriodogram.

So, the following two commands should produce (almost) identical output:

  • AFNI:

3dPeriodogram                                            \
    -taper 0                                                    \
    -prefix DSET_FREQ                     \
    DSET_TIME

  • sps.periodogram():

fvals, ARR_FREQ = sps.periodogram(ARR_TIME, scaling='density', window=None,
                               detrend='linear')

if ARR_TIME and DSET_TIME contain the same time series.
→ Now, the almost:

  • for a time series of, say, N=128 time points, 3dPeriodogram will output a frequency series of N=64 time points, and sps.periodogram() will output a time series of 65 points. The difference in length is due to sps.periodogram() outputting the baseline/constant value: this will be default by zero, but one could turn off detrending, so this wouldn’t be trivial. I guess because 3dPeriodogram does always detrend, that value is always zero, and hence not output.
  • for a time series of odd N, the lower frequencies match, but the higher ones differ slightly. I am not sure why—I need to ponder this. The two methods are doing something different to deal with the odd number of time points, and I have to ponder.
  • The sps.periodogram() power spectrum is exactly 2x the value of the 3dPeriodogram value in each associated frequency point (for even N). I believe what is happening here is: for N input time points, the Fourier relations give N output frequency points. However, for real-valued time series, there is a symmetry of positive and negative frequencies, so that there are only N/2 independent ones. Often, people only report the positive half of the spectrum, for wave number k=0…N/2 values (or k=1…N/2 values, in 3dPeriodogram’s case). Now, in terms of power-at-a-given-frequency, one would add the power values of the positive and negative frequencies—I suspect that sps.periodogram is doing this, to give total power at the frequency, while 3dPeriodogram is returning the power of that positive half-spectrum. You can choose what is a more appropriate value for your context of power-law spectrum.

I hope that makes sense. As with all things, there is a lot of subtlety when moving between different programs, even for something as fundamental as the FFT.

–pt

Hi Paul,

thank you a lot for the elaborate explanation! See my replies below.

Correct. This is why I showed the power spectra (and not their log-log version) in my first post. The “problem” (the difference in power) has nothing to do with the log, but is already present in the standard power spectra.

I changed the detrending option to "detrend='linear'", because I read that 3dPeriodogram uses linear detrending in the AFNI page of 3dPeriodogram. (Just as a side note here: the detrending option as well as the window option do not really change the power and its distribution in the standard power spectra (or in the log-log power-law spectra and their associated PLE=slope value), but they rather "smooth" the graph a bit differently).

I experienced that 3dPeriodogram does not allow an nfft number that is equal to the length (TRs) of the time-series, while normally that should be fine. As far as I remember (from my testing), 3dPeriodogam requires an nfft number that has the length of: time-series (N)+1 or N+2. I assume that this is related to the baseline/constant value you are talking about? I now always use a power of 2 (e.g. 1024 if the time-series has 560 time points).

I think this is the solution to my problem! As I wrote before, the PLE computation (a fitting of a linear regression line to the log-log power spectra) on power spectra created by sps.periodogram() and sps.welch() always yield approximately twice the PLE value than on power spectra created by 3dPeriodogram and 1dFFT.

If I apply the square root on the power output of sps.periodogram() and sps.welch() (e.g. np.sqrt(Power) in Python), the resulting PLE value turns out to be approximately the same as the PLE value for 3dPeriodogram and 1dFFT power spectra.
Conversely, if I square the power of the 3dPeriodogram results in Python (say "Power = Power**2 in pythonic), the resulting PLE value is again approximately the same as when using sps.periodogram().

There is a slight difference in the PLE value. But this difference, I assume, simply stems from the fact that in option 1 (3dPeriodogram and 1dFFT) power spectra were computed for every voxel, then averaged across the voxels with 3dmaskave, and finally the power-law is computed in Python.
While in option 2, all voxels’ time-series were extracted via 3dmaskave, and “one” power spectrum was computed in Python using sps.periodogram() (or sps.welch()). This, of course, can yield slightly different power spectra and consequently PLE values that differ a bit.

As far as I remember, I have never seen people reporting in EEG or fMRI papers what kind they used to compute the PLE. This is surprising, because, as we saw, the resulting PLE can increase/decrease up to a 100%.

Philipp

Philipp-

For your power-slope estimate, you would only use the positive half of the spectrum, anyways, and likely not include the k=0 (baseline) wave number. This is due to the nature of the Fourier spectrum coefficients for real input time series: they have a mirror symmetry around 0. That is why most FFT-based outputs are just comprised of essentially the k=0…N/2-1 wavenumbers, and not k=-N/2…N/2-1, or k=0…N-1. In the latter two cases, you would be fitting a half-downward set of points and then equal-but-oppose half upward set of points—that would give you zero total slope. I believe you would likely want to not include any k=0 baseline value in your estimation, because that is just the average value—it doesn’t seem appropriate to include in most power spectrum slope estimations.

Also, since we are talking about slope, you should get the exact same slope with only a factor of 2 difference when using either sps.periodogram() or 3dPeriodogram with:

  • the same tapering (e.g., none) and
  • same detrending (e.g., linear) and
  • both ignoring the k=0 value (not output by 3dPeriodogram, and de-selectable in sps.periodogram() output with index selectors: array_freq[1:])

The issue of how much detrending changes the spectral estimate or not depends strongly on what your data looks like. If you are using residuals and/or processed resting state time series, then I would expect detrending to do very little to change the power spectrum.

–pt

Paul, thanks.

Let me ask you a further question to maybe solve this and provide you with more details.

Some facts first.

  • The preprocessed time-series (the .errts file) is given to 3dPeriodogram.
  • 3dPeriodogram creates the power spectrum (no tapering, nfft=1024, time-series has 5xx sampling points).
  • 3dTcat then cuts the output by 3dPeriodogram to my desired frequency range, i.e., it deletes all frequency bins below 0.01 and above 0.25 Hz.

How do I know which bins of the frequency-domain (the 3dPeriodogram output) I have to delete? To answer this question, I created my own ideal-frequency .txt file. To create this file, I use the following formula: 1/(nfftTR). Hence, in my case, 1/(10242) = 0.00048828125.

Now, I add this number (0.00048828125) up in a .txt file starting with row 1, where each next row corresponds to this number times 2, times 3, times 4… until my Nyquist frequency is reached. Since AFNI starts counting with 0 (instead of with 1, like many programming languages) I can count the number of rows that correspond to my desired frequency range. This range is given as input for 3dTcat, so that 3dTcat can cut out only the desired frequency range of the power spectrum in AFNI.

Would you agree that nothing is wrong with this approach so far?

In Python I likewise cut the range, but I start with 21 instead of 20, since Python included zero (0) as the first value. This is what you already stated, and one can easily check the frequency range created by sp.Periodogram() by simply printing the results/computations via “print(…)”. One then sees that it really starts with 0.

Therefore, the required frequency range is [21:512] for the sps.periodogram() result (instead of [20:511] as in AFNI).
It would look like this:


Frequency, Power = sp.signal.periodogram(Data, fs=0.5, window=None, nfft=1024, detrend="linear", scaling="density")

Frequency = Frequency[21:512]
Power = Power[21:512]

The images below show you the results for one subject, one image with 3dPeriodogram, the second image with sp.signal.periodogram. How are such differences possible? Am I doing a mistake somewhere?

Hi, Philipp-

To do bandpassing within a ceratin range of Hz, indeed you need to convert the “digital” frequencies to those of physical units (Hz), and indeed this depends on the sampling rate, TR, and number of time points, N. Let’s stick with even N for the moment.

The upper frequency (Nyquist) is determined just by TR:
Fmax = Fnyquist = 1/(2TR).
The spacing of the frequency spectrum samples depends on this and the number of time points:
df = Fnyquist/(N/2) = 1/(N
TR).
Sometimes, if people want different frequency sampling, they zeropad (or “meanpad”) their time series, but that doesn’t add information, just might interpolate the frequency spectrum; also, from Fnyquist’s definition, doing that padding doesn’t change the max frequency one can model.

So, each frequency in your (half)spectrum is kdf, for k=0…N/2; k=0 is the special case of the “baseline” or mean value. The maximum frequency would occur at k=kmax=N/2, and note that:
kmax
df = (N/2)1/(NTR) = 1/(2*TR) = Fnyquist,
which is consistent with the earlier information. NB: these are talking about the frequencies themselves (the “x-axis” in frequency space), not the power values associated with each.

So, in your case of wanting a bandpass interval [A, B] ~ [0.01, 0.25], you want to find:

  • the maximum integer A such that A*df <= 0.01,
  • the minimum integer B such that B*df >= 0.25.
    So, I think you want:
  • A = floor(0.01df) = floor(0.01/NTR)
  • B = ceil(0.25df) = ceil(0.25/NTR)
    And yes, you can then use index selectors with the A and B values to select out data you want.

You mention having “5xx sampling points”—does that mean you upsampled by a factor of 5? I don’t know what “5xx” means. Again, upsampling won’t add information nor energy to the signal (assuming you are meanpadding, and not including the k=0 frequency in your power evaluations.

Note that the resting state signal in general will not be a “flat” spectrum—the named noise distributions in signal processing are, like “white noise” (which has slope=0), purple noise, pink noise, brown noise, … etc; see:
https://en.wikipedia.org/wiki/Colors_of_noise
It will be big in the lower side of frequencies—in the typical ALFF range—end then mostly drop off at higher frequencies. I am not sure that a line will ever be a good fit, in either the power-frequency space, or log(power)-log(frequency) space. I think the plots you are showing have the shape I would roughly expect.

As to the differences between the two—well, I am not sure. Up above, we discussed that for no tapering, linear detrending for each, etc., they 3dPeriodogram and scipy.signal.periodogram() yielded the exact same results. Doing the same range of bandpassing on each shouldn’t change that. I guess I would check that your interpolation is being done in the same way, if it must be done (and must it? I don’t see why).

–pt

I did not remember the exact number of TRs, therefore I simply wrote "5xx", because I have 500 something TRs in one run. I did not upsample the time-series for different reasons, one of them because the upsampling would make them more linear. Sorry for the confusion.

[quote="Note that the resting state signal in general will not be a \"flat\" spectrum---the named noise distributions in signal processing are, like \"white noise\" (which has slope=0), purple noise, pink noise, brown noise,"][/quote]

Correct and thanks. Yes, I know, this is exactly part of what I am investigating. This is one of the reasons why I am so much after "correct" power spectra and their log-log plots.

Everything is kept identical between 3dPeriodogram (and all AFNI steps) and sps.periodogram() as close as possible. However, they still yield this difference. I don't know why. The only explanation I have is that for 3dPeriodogram we averaged thoursands of power spectra (one power spectrum per voxel in a huge ROI), whereas for sps.periodogram() I started with the extracted (average) time-series of the same ROI, and then computed the power spectrum in Python.
However, the dfference in the results (including the power-law slope) is so huge that it seems odd to me.

If you are also at the end of your ideas here, then I will stick with 3dPeriodogram for two reasons: first,I prefer the averaging of many power spectra across the voxels, and second, the resulting power-law slopes are “realistic”, while the ones in sps.periodogram() are not.