Hi,
I used 3dNetCorr to generate ROI-based correlation matrices. Howerer, I also have some questions about this.
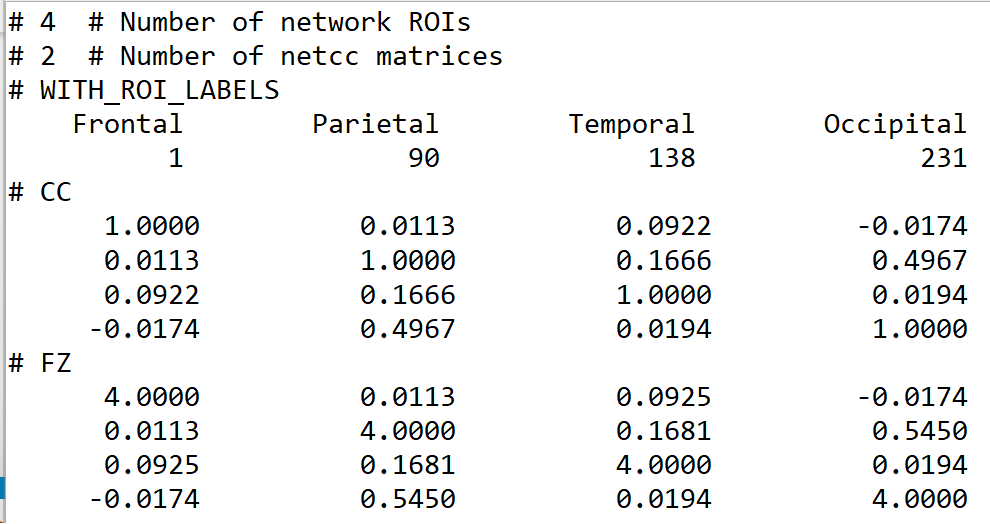
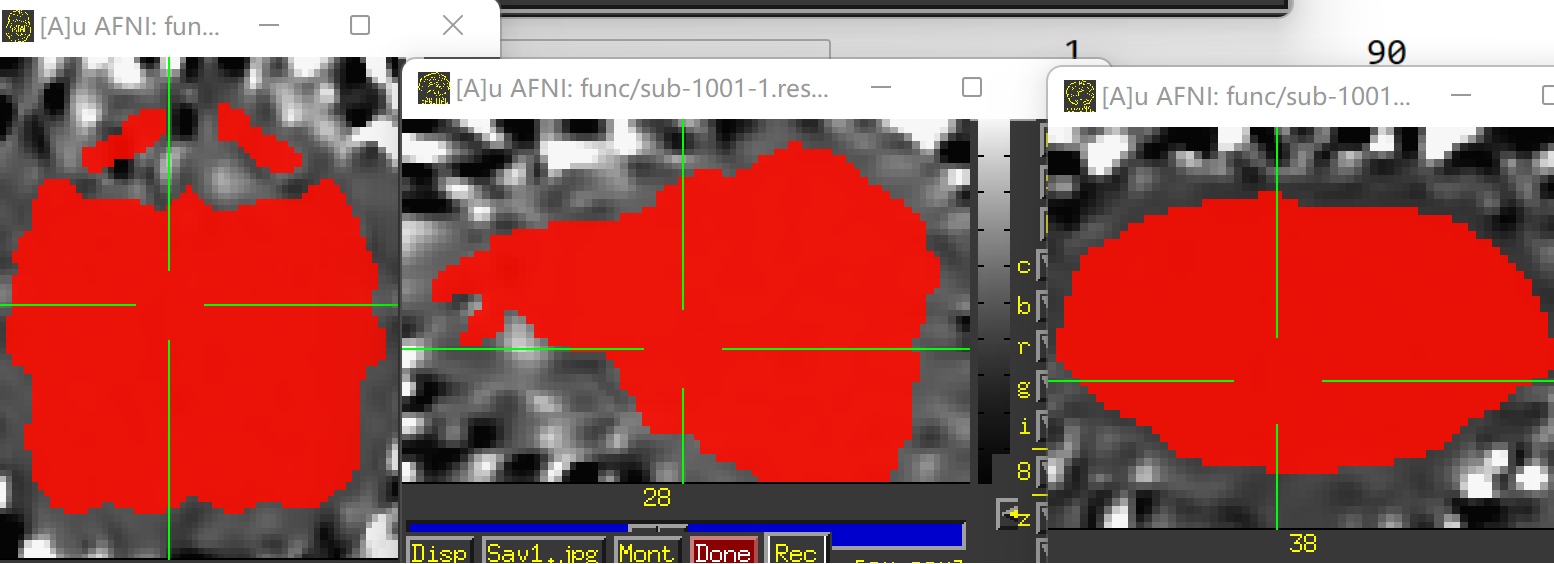
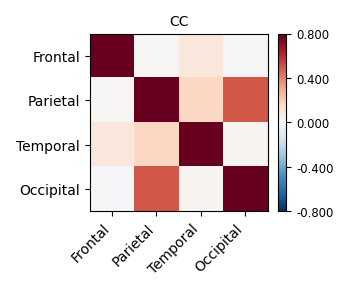
- Refer to 11.2.2. Rest FMRI processing: the MACAQUE_DEMO_REST — AFNI, SUMA and FATCAT: v24.1.11 (nih.gov), I used the following code the calculate FC between ROIs with CHARM altsa (which is already in the final output space through "-ROI_import' in afni_proc.py command). However, the results seem stronge (eg., the frontal cortex has low FC with parietal cortical)
3dNetCorr -echo_edu
-overwrite
-allow_roi_zeros -push_thru_many_zeros
-fish_z
-inset errts.sub-1001-1.nii.gz
-in_rois ROI_import_CHARM_resam.nii.gz
-prefix FC_CHARM
When I added " -mask full_mask.sub-1001-1.nii.gz " (the mask is from the output of afni_proc.py: full_mask.sub*), the result significantly changed
I know that my data has some dropout and distortion, so a couple finer ROIs end up. If I want to conduct gradient or Network analysis after calculate FC between ROIs, should I provide a mask? If sure, could the mask from the output of afni_proc.py be used (full_mask)?
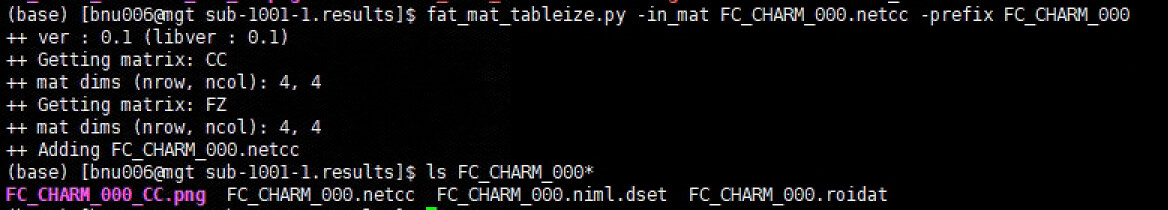
- I used fat_mat_tableize.py commond to convert *.netcc file to *.txt file. Unfortunately, it didn't seem to have worked out (could not see *.log and *.txt file). So how can I convert *.netcc file output by 3dNetCorr to *.mat or *.txt or *.csv file, as I want to do further analysis in Matlab or R.
Best regards,
Ruilin
Hi, Ruilin-
Re. the correlation matrices-
The images showing the overlap of the atlas regions with the FMRI data are useful to see. The overlap is not great. The salmon/orange region in particular appears to stick out above where the brain data actually is. That means many of the voxels within it are really just containing noise, and averaging them into the ROI mean signal washes it out/introduces noise or artifact. When you intersect that atlas map with the brain mask, much of the atlas map will go away, restricting the voxels more. I think something in some alignment step is not looking good. Is that atlas really in the same space as the FMRI data?
For fat_mat_tableize.py, hmm, I have not looked at that program for a long time. I think you would be better off starting with the *.netcc files directly, currently. Those are just text files you can open up.
--pt
Hi, ptaylor
Thanks for your reply. I have run afni_proc.py for another subject and the alignment looks good. However, I still have question about 3dNetCorr.
- Due to some dropout and distortion for my rs-fMRI data, a couple ROIs end up. Is it necessary for me to provide a mask (e.g., full_mask) when use 3dNetCorr to calculatr FC between ROIs. (The underlay image is errts* and the overlay image is full_mask)
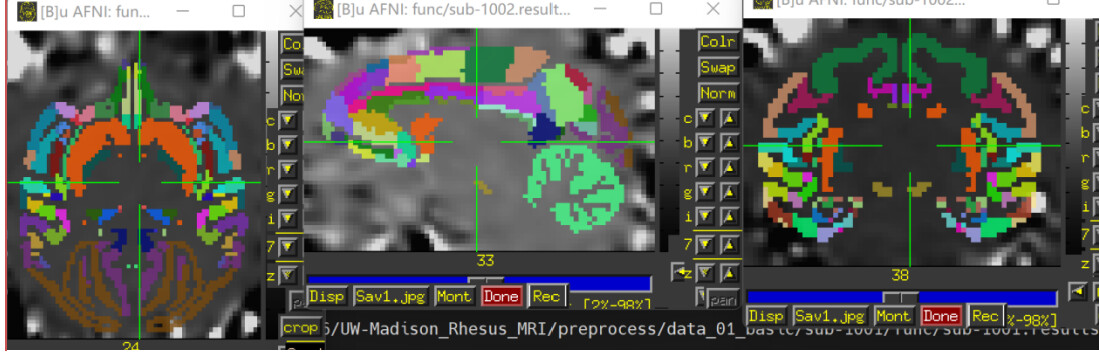
(The underlay image is errts* and the overlay image is D99 altas)
(The underlay image is errts* (already masked with full_mask) and the overlay image is D99 altas)
-
I'm confused about the image after scale, as the signals are uniform across the brain, with no contrast between brain regions. Also, the brain area seems to get bigger. Should I do scale with the purpose of calculating FC between ROIs? The following image is been smoothed and scaled respectively.
-
I found that the signals are also uniform across the brainthe with errts* image, is it right? In addition, I wonder why there are also some signals out the mask? Did I make a mistake?
Best regards.
Ruilin
Hi, Ruilin-
Q2 and 3: A couple factors combine to have the errts look so flat and wasteland-ish.
- The mean value of the
errts* dataset is zero, because it is the residuals of modeling.
- During processing, the
scale block is usually included, so that the EPI time series are mapped to have the interpretation of "local BOLD % signal change" (from the original EPI units which are arbitrary and uniterpretable on their own). BOLD % signal change values in the brain are typically about one-to-a-few percent; outside the brain they can be much larger.
So, the brain-region errts* data is uniformly of mean zero throughout time---regardless of whether a voxel was originally in gray matter, white matter or CSF---and the variations in it are relatively small compared to the noisy stuff outside the brain. Hence, it looks like a uniformly gray patch with only slice variation, compared to the background. that is what you are observing in those images.
Regarding the apparent increased size: scale comes after blurring. The apparent increase in size is due to the blurring of brain signal "outwards" over the low-mean-value background.
Q1: because of the distortions, indeed it might make sense to pre-mask your regions (or equivalently to include the mask to 3dNetCorr). Because the brain data is blurred outward, some of those regions outside the direct brain overlap do still have brain signal, but they will be washed out and much lower TSNR. Masking the regions should mean that you are averaging together voxels with better signal strength.
--pt