I’m new to the 3dMVM game so please feel free to direct me to a previous thread if you’ve already answered this. Just want to make sure that our coding matches our questions.
We have two quantitative variables per subject: 1) CSF concentration of the dopamine metabolite homovanillic acid (HVA); and 2) age, which tends to be weakly but significantly correlated with HVA. Within a single group, we’d like to look at the following in relation to some rsfMRI indices:
HVA, with the relation between age and the rsfMRI DV accounted for
age, with the relation between HVA and the rsfMRI DV accounted for
It seems that this could be handled by the following:
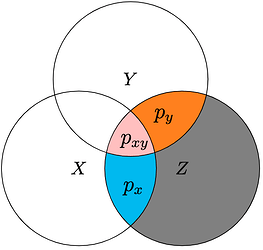
What if I’m interested not in how HVA and age might uniquely account for variability in the rsfMRI data but the complement to the that: how the shared variance in age and HVA could relate to the imaging indices? Probably most efficient to handle this first on the side of the two predictor variables–i.e., calculate each subject’s projection onto the first principal component of age and HVA and then use that as a qvar in 3dMVM.
Sorry. I feel like this is turning into stats therapy more than AFNI advice. Feel free to direct me to other resources you’ve either developed or found useful.
Paul, your 3dMVM specification looks fine to me. However, you may consider using 3dttest++ or 3dRegAna for your next question.
What if I’m interested not in how HVA and age might uniquely account for variability in the rsfMRI data but the
complement to the that: how the shared variance in age and HVA could relate to the imaging indices?
However, you may consider using 3dttest++ or 3dRegAna for your next question.
Do you have suggestions for how to implement a shared-variance analysis with 3dttest++ or 3dRegAna?
I would think it could be done with just 3dMVM, with a little work beforehand in Matlab or Excel. For example, say we have predictor variables X and Y that are correlated and we want to see the relation of their shared variance to Z. What if I were to enter two qvars into 3dMEMA: 1) X residualized against Y (i.e., X with no shared variance with Y in it); and 2) just X. Wouldn’t the marginal effect of X in this model give me what I’m looking for? Check my thinking?
how the shared variance in age and HVA could relate to the imaging indices?
How to quantify the relatedness in this context? One approach is to use the coefficient of determination R^2 in a regression model that measures the proportion of the variation in the response variable Z that is predictable from the explanatory variable(s).
With two explanatory variables X and Y, you can construct three separate models for the response variable Z:
Z ~ X,
Z ~ Y, and
Z ~ X + Y.
Then obtain R_0x^2 from model 1), R_0y^2 from model 2), and R_1x^2 plus R_2y^2 from model 3). Presumably,
Sorry for my late reply. Just getting back online following the holidays.
Thank you for turning me on to 3dRegAna. I just went over the manual. What a nice and flexible tool. The process you present implements the same approach I had in mind but much more elegantly. I also like how one can play around with different models…
Thanks, again, for the help!
Paul
The
National Institute of Mental Health (NIMH) is part of the National Institutes of
Health (NIH), a component of the U.S. Department of Health and Human
Services.