I'm looking to assess a very particular contrast involving a categorical x categorical x quantitative triple interaction.
Quick background
My project assesses whether a particular TMEM gene allele offers a protective effect against gray matter atrophy in individuals with genetic frontotemporal dementia.
In R formula syntax the model I am looking at is as follows:
pGM ~ FTDGene_CarrierStatus * TMEM_IsProtective * TimeFromBaseline + AgeAtBaseline + Sex + TIV + (1 | Site / Family / Subj)
(spaces added for readability)
Where:
Variable              Detected_Type Details
Subj                  Subjects      Num Subjects=304
ID                    Categorical   Unique levels=1013
TIV                   Quantitative  Min=1037.11 | Max=1917.92 | Num outliers=9
TMEM_IsProtective     Categorical   Counts: NonProtective=380 | Protective=633
FTDGene_CarrierStatus Categorical   Unique levels=5
TimeFromBaseline      Quantitative  Min=0 | Max=7.200546
AgeAtBaseline         Quantitative  Min=19.35387 | Max=85.67283
Sex                   Categorical   Counts: Female=592 | Male=421
Site                  Categorical   Unique levels=20
Family                Categorical   Unique levels=132
To clarify, FTDGene_CarrierStatus is 5 levels (Control and GRN/C9orf72 Presymptomatic/Symptomatic)
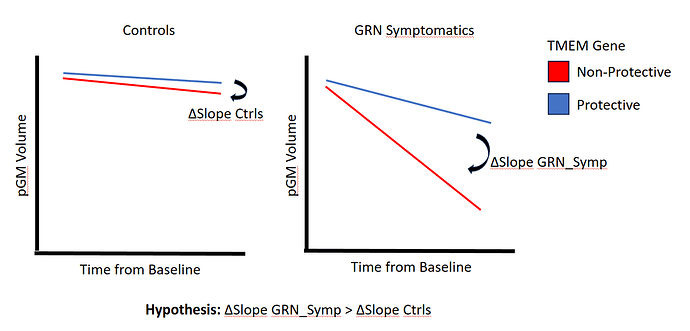
A picture is 1000 words, so I'd summarize my hypothesis as follows:
My Questions
- After doing a trial run with a more parsimonious model (no covariates), the results look promising, but I'm second-guessing myself at the formulation of my gltCode and would like to request a clarification:
	-gltCode DeltaSlope_C9Sympint	'TMEM_IsProtective : 1*Protective -1*NonProtective FTDGene_CarrierStatus : 1*C9orf72_Symptomatic -1*Control TimeFromBaseline :'			\
-gltCode DeltaSlope_GRNSympint	'TMEM_IsProtective : 1*Protective -1*NonProtective FTDGene_CarrierStatus : 1*GRN_Symptomatic -1*Control TimeFromBaseline :'			\
-gltCode DeltaSlope_C9PreSymp	'TMEM_IsProtective : 1*Protective -1*NonProtective FTDGene_CarrierStatus : 1*C9orf72_Presymptomatic -1*Control TimeFromBaseline :'			\
-gltCode DeltaSlope_GRNPreSymp	'TMEM_IsProtective : 1*Protective -1*NonProtective FTDGene_CarrierStatus : 1*GRN_Presymptomatic -1*Control TimeFromBaseline :'			\
These test the interaction effect in differenes of slope changes as per diagram, yes?
-
I noticed that there appear to be two volumes output for each of the gltCode above. I assume that each pair of volumes corresponds to one of the one-tailed directions, as there aren't any negative values therein, right? Anecdotally, one of the two volumes is near-zero and the other has clusters, so I'm 99.9% sure this is the case, but I would just appreciate a sanity check. Forgive my ignorance, as I was more used to working with FSL/SPM's outputs where t-contrasts give both positive and negative direction outcomes in the same volume.
-
I noticed that specifying
qVarsresults in each specified variable being automatically centered. Since I'm looking at slopes, this is irrelevant. For future studies however, I would like the interpretation of the intercept to refer to the x-axis variable being zero, not the mean. Is there a way to specify that a variable is quantitative but have it NOT be centered automatically?
Thanks in advance and I will be more than pleased to give reference to AFNI on anything that comes of this! Fingers crossed!
Best,
Maurice
